Describing Data
This Year 5 data handling scheme of work focuses on the use of graphs to describe the data they present. The children will look in detail at how information is presented using tables, bar charts and line graphs and the ways in which these presentations can tell the story of the data as well as how they can be manipulated to convey a desired message.
This downloadable series of lessons includes lesson plans, slideshow presentations and printable teaching resources.
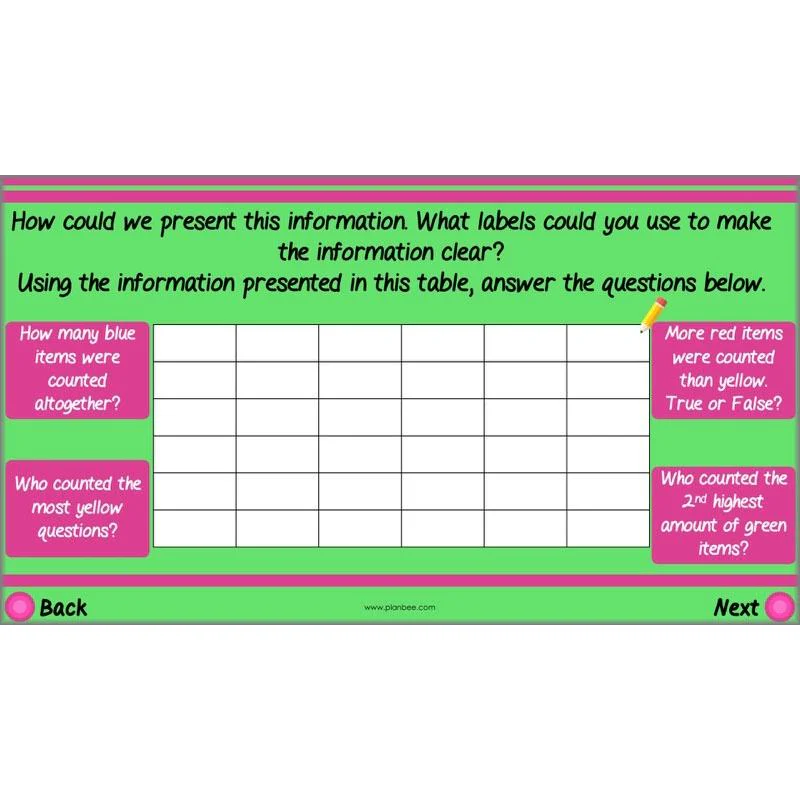
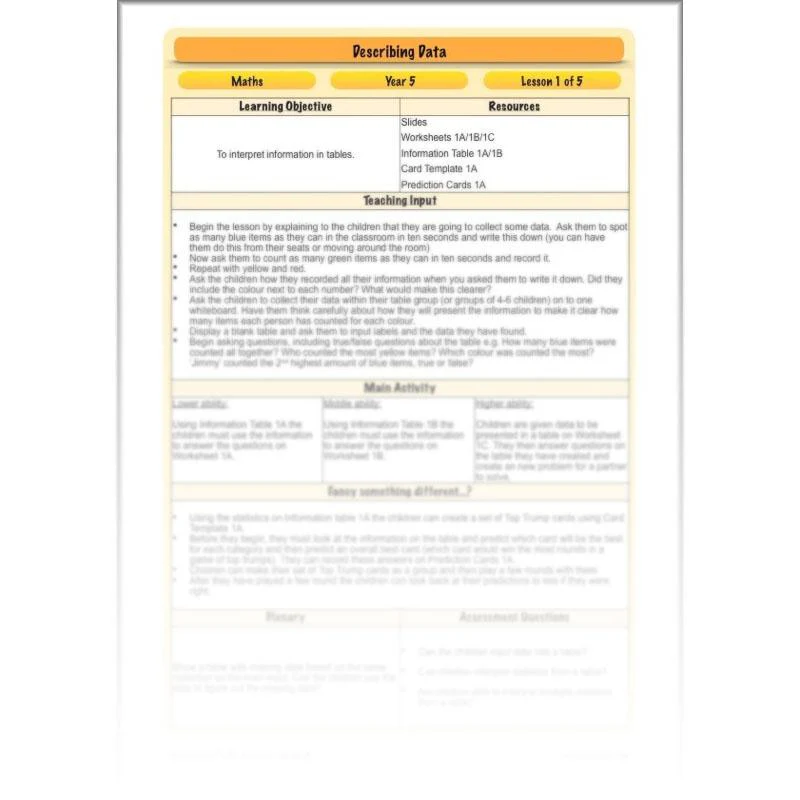
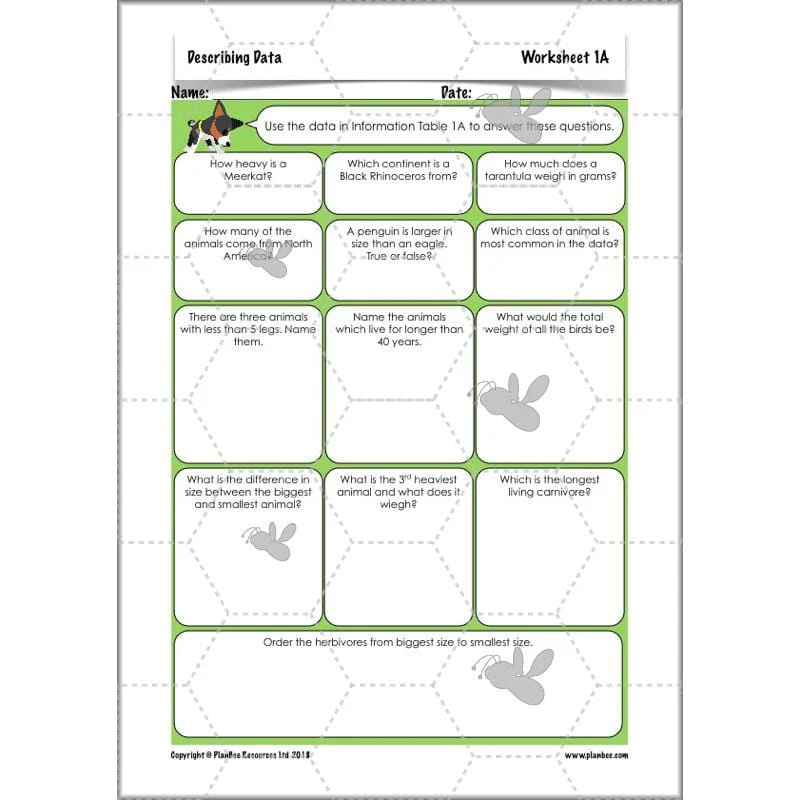
Tricky tables
This first lesson challenges the children to master their understanding of data in tables and use this to pick out desired information. They must look carefully for key information within tables and use this to complete the missing data.
This downloadable lesson includes a lesson plan, a slideshow presentation and printable teaching resources.
What's included:
- Lesson plan
- Slides
- Activity ideas
- Differentiated worksheets
- Information tables
- Flashcard templates
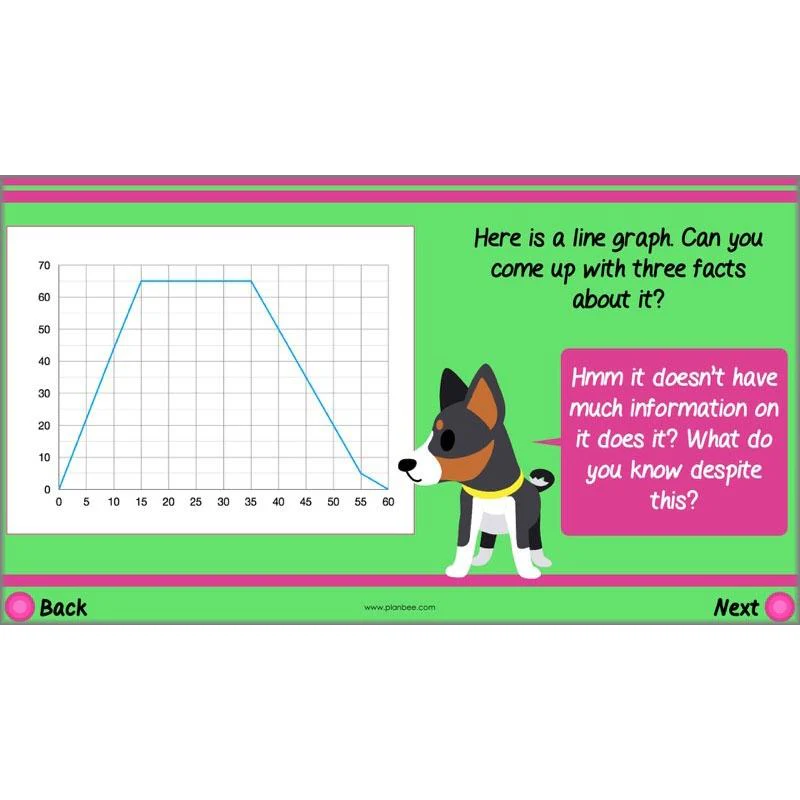
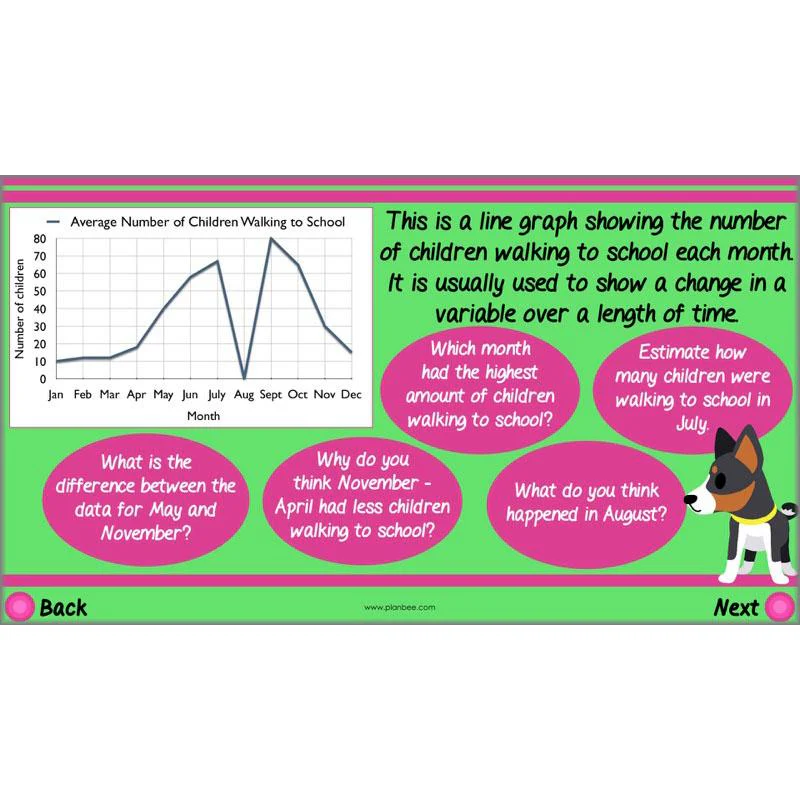
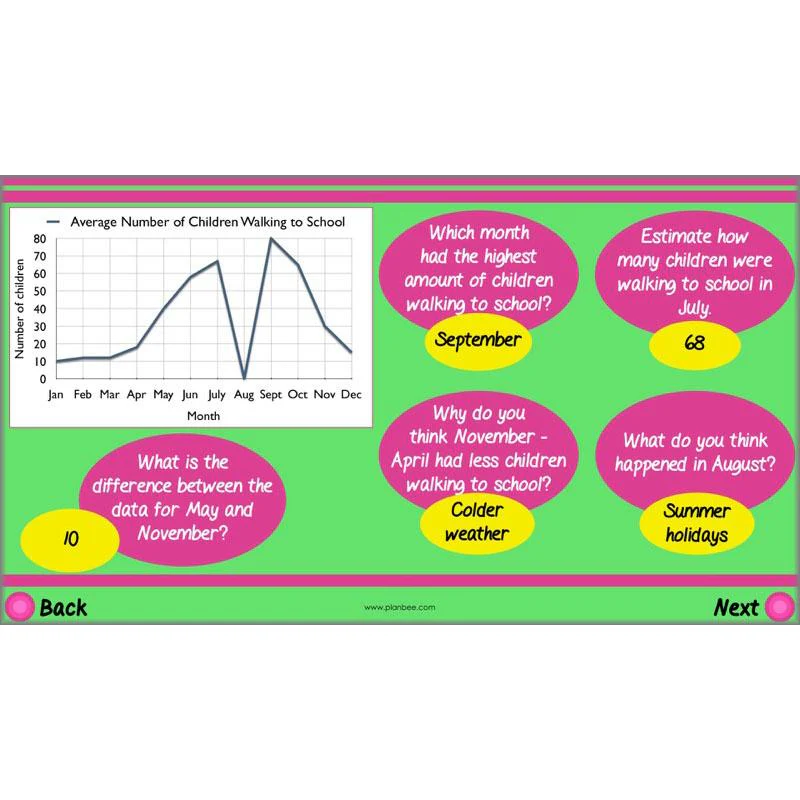
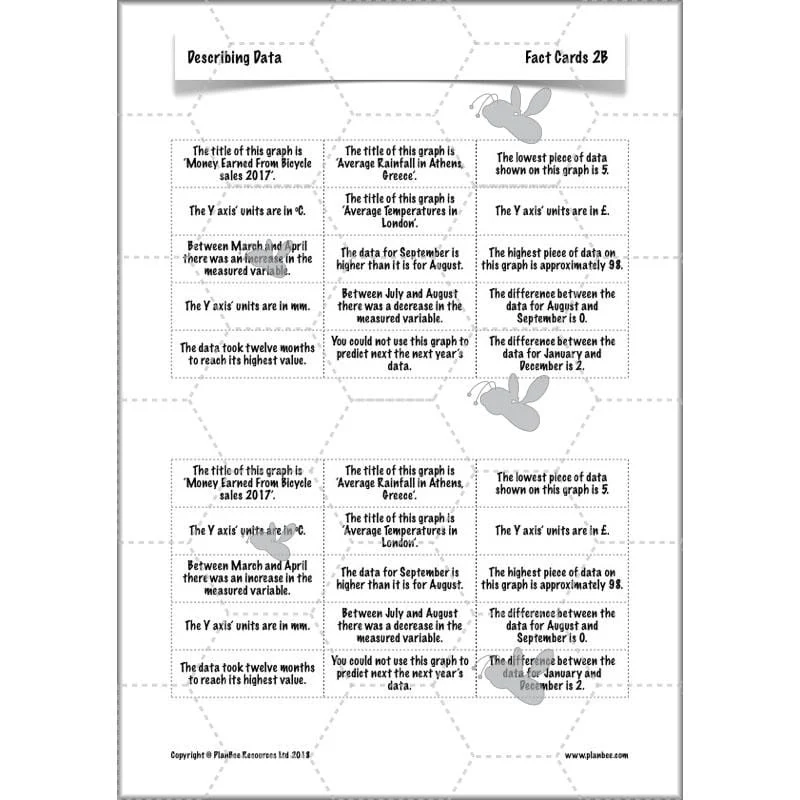
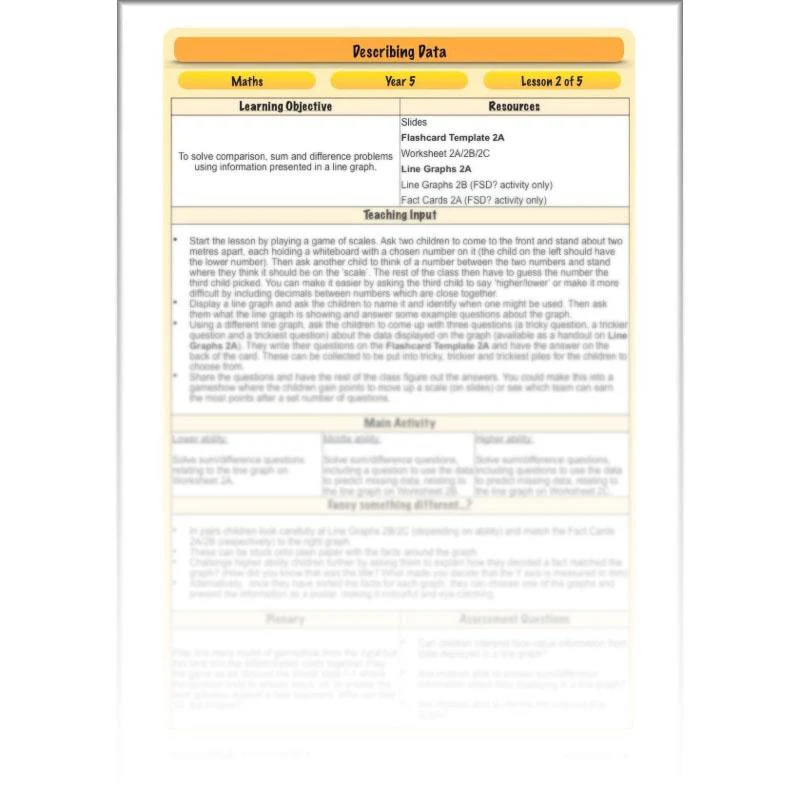
Line Graph Problems
This lesson gives the children the opportunity to practise and master their skills when interpreting information in a graph. They have the opportunity to read simple information from line graphs as well as using them to predict future data and come to conclusions in response to questions about the data presented.
This downloadable lesson includes a lesson plan, a slideshow presentation and printable teaching resources.
What's included:
- Lesson plan
- Slides
- Activity ideas
- Differentiated worksheets
- Flashcard templates
- Line graphs
- Fact cards
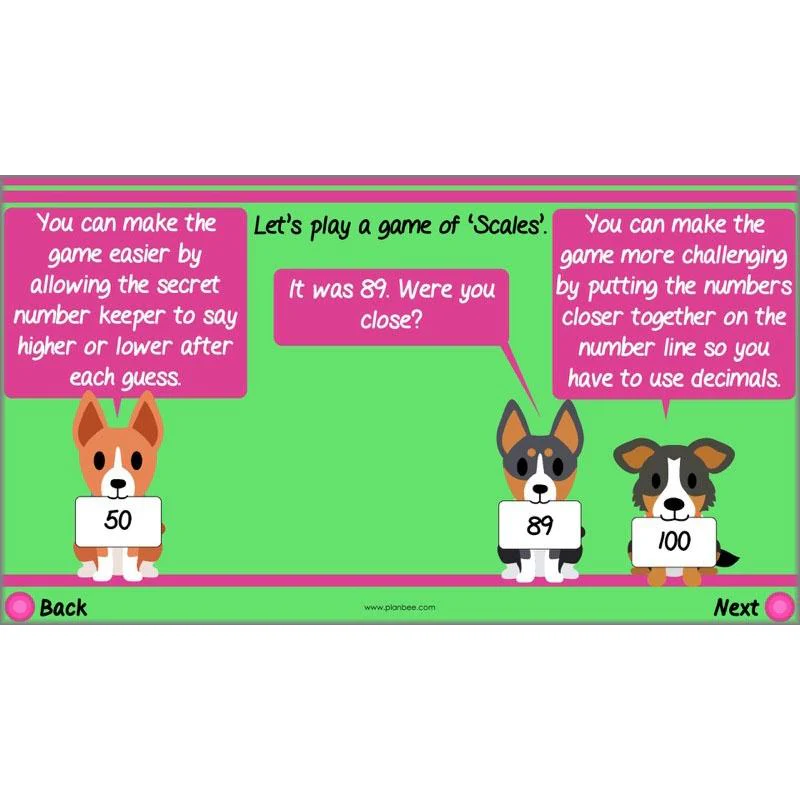
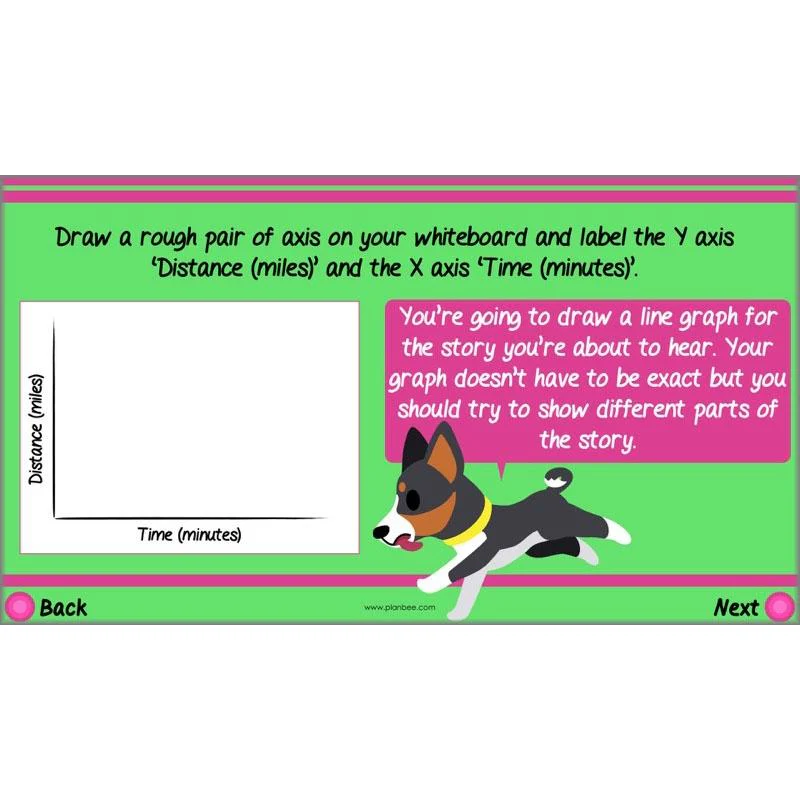
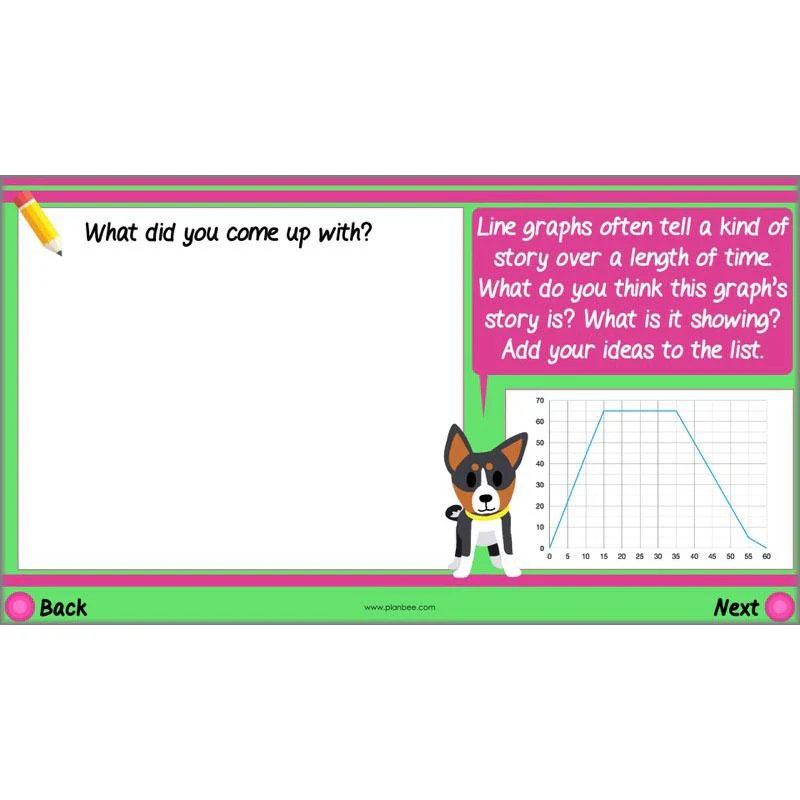
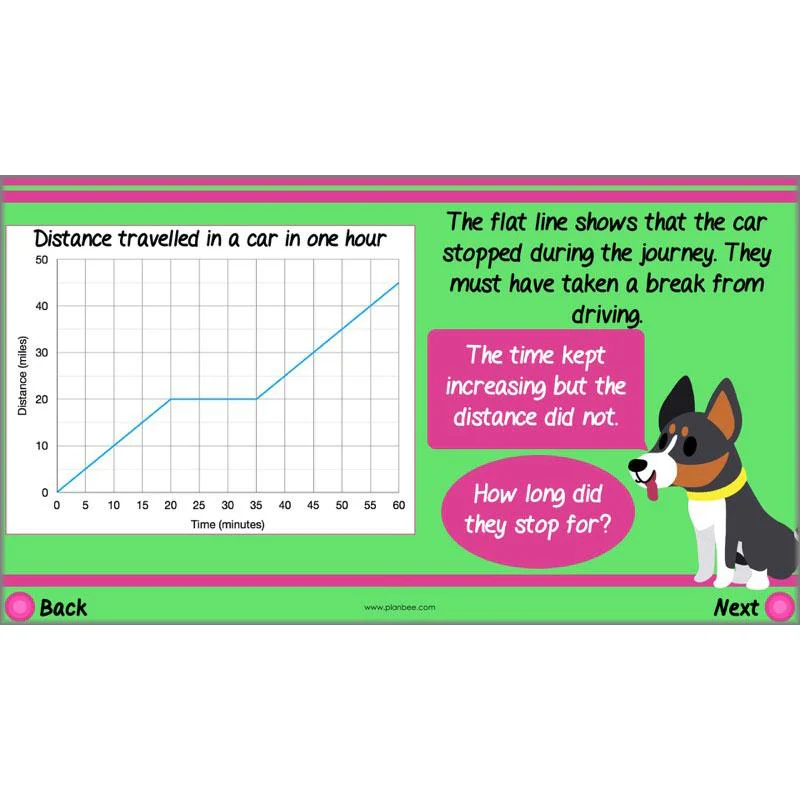
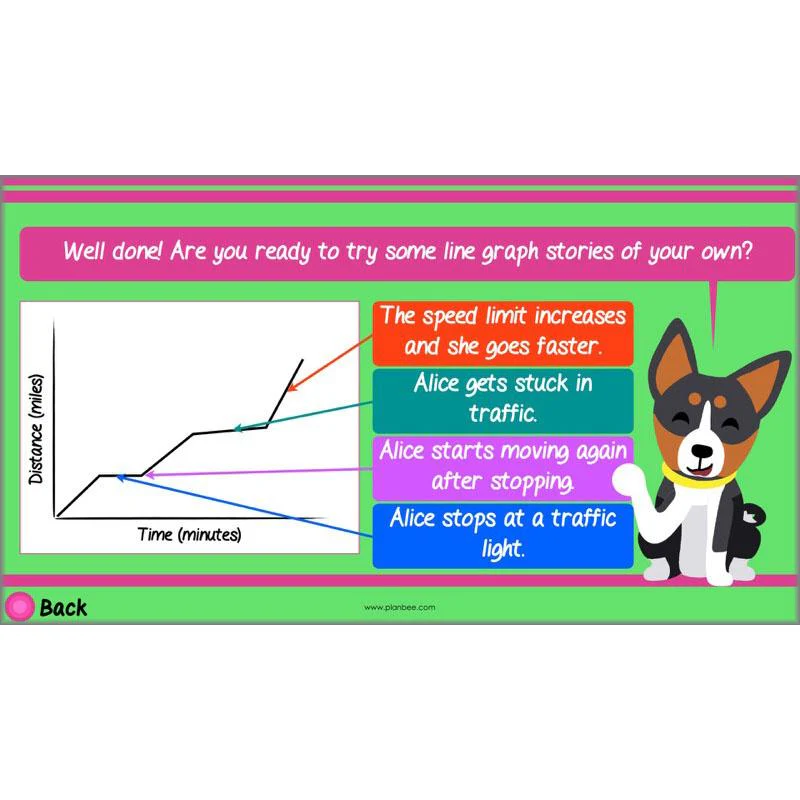
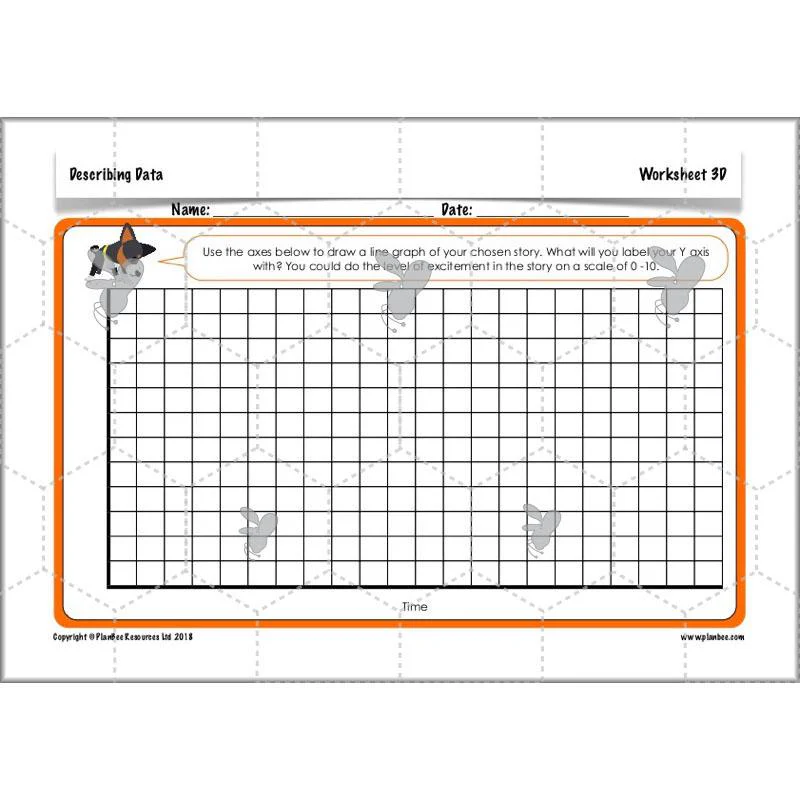
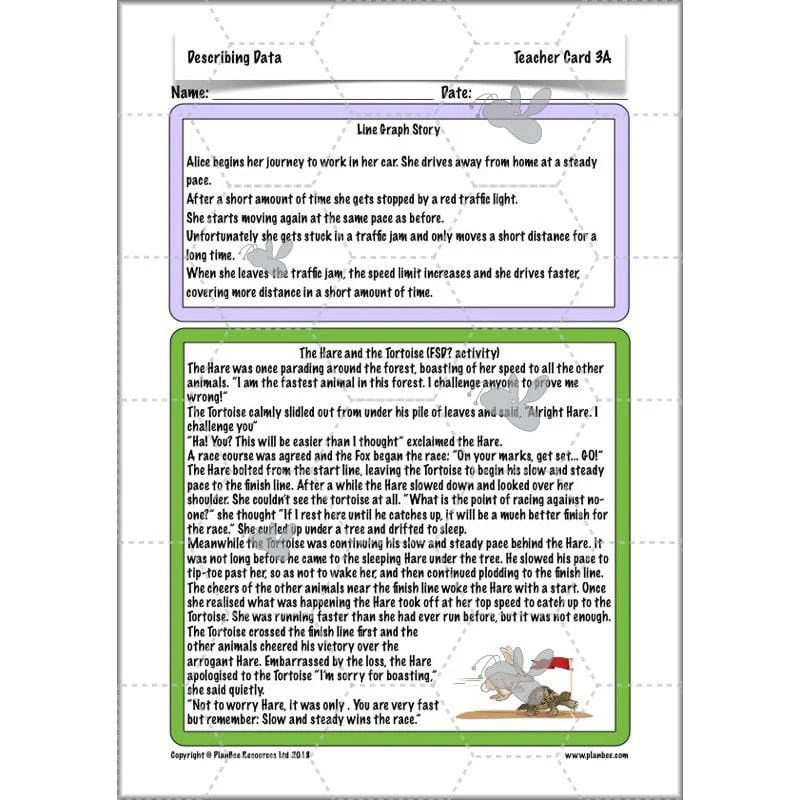
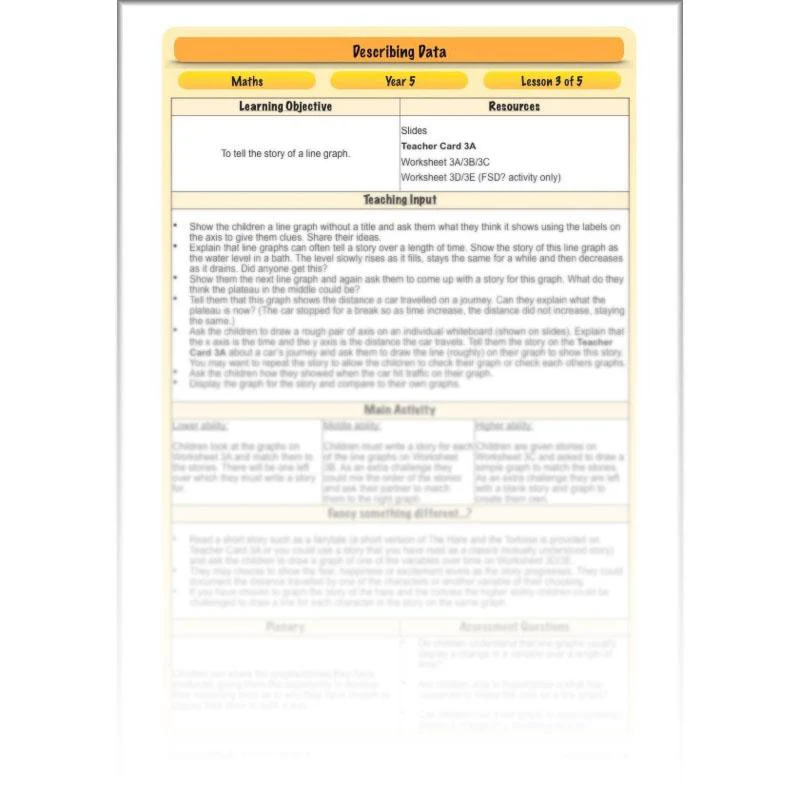
Line Graph Stories
Have your class explore and discover how line graphs can tell a story over time. The children can investigate how the steepness of a line can show different points in a story and use their imaginations to create stories to match lines in a graph.
This downloadable lesson includes a lesson plan, a slideshow presentation and printable teaching resources.
What's included:
- Lesson plan
- Slides
- Activity ideas
- Teacher Card
- Differentiated worksheets
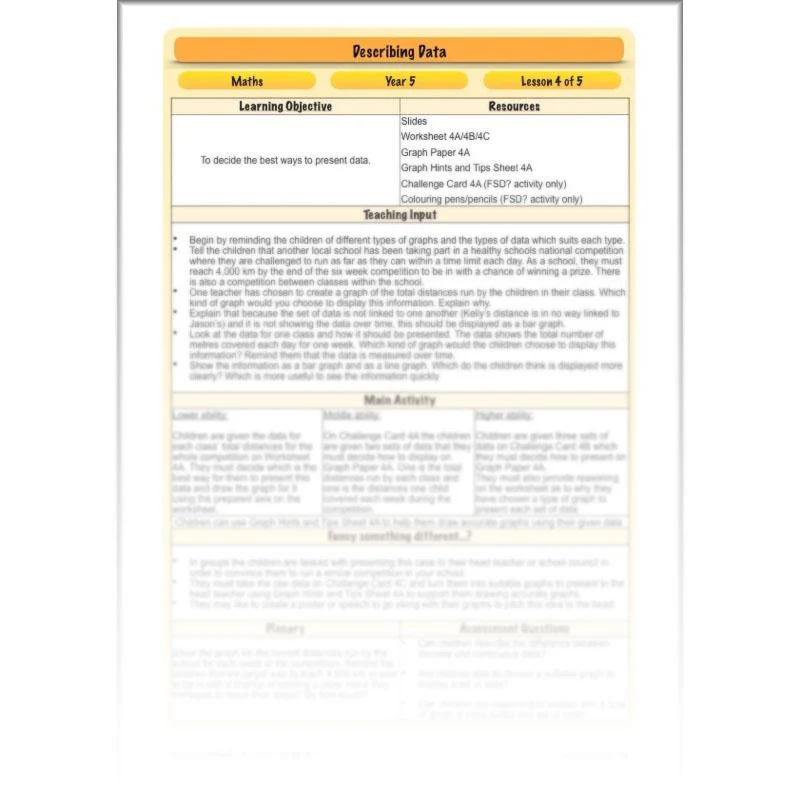
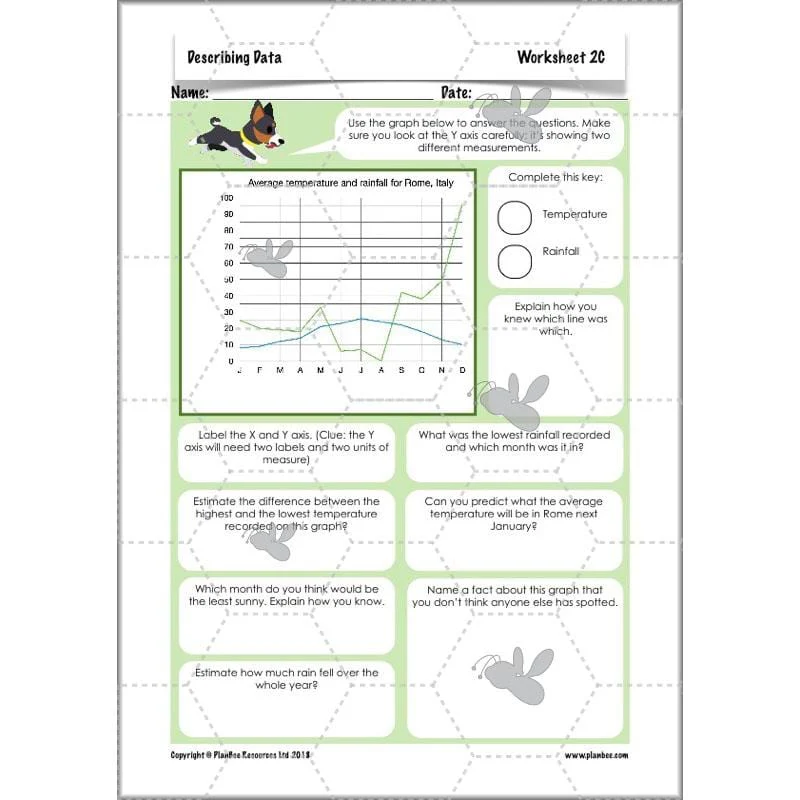
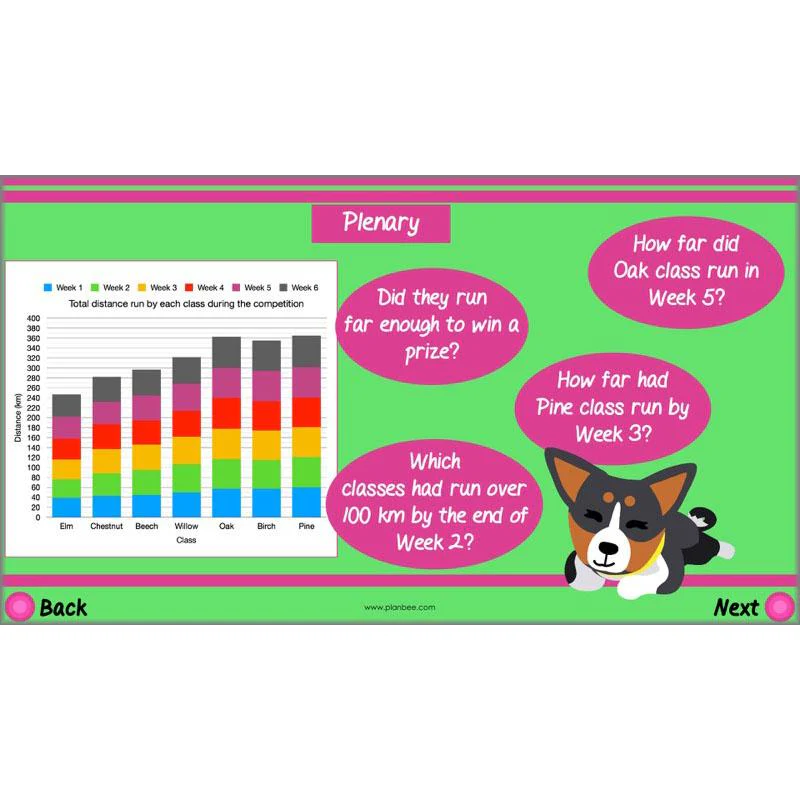
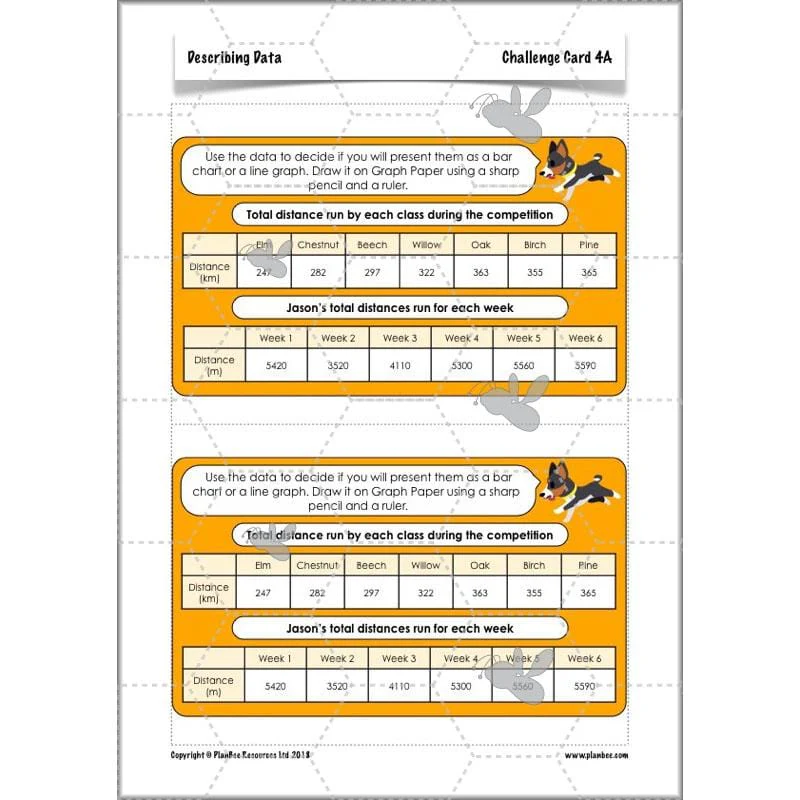
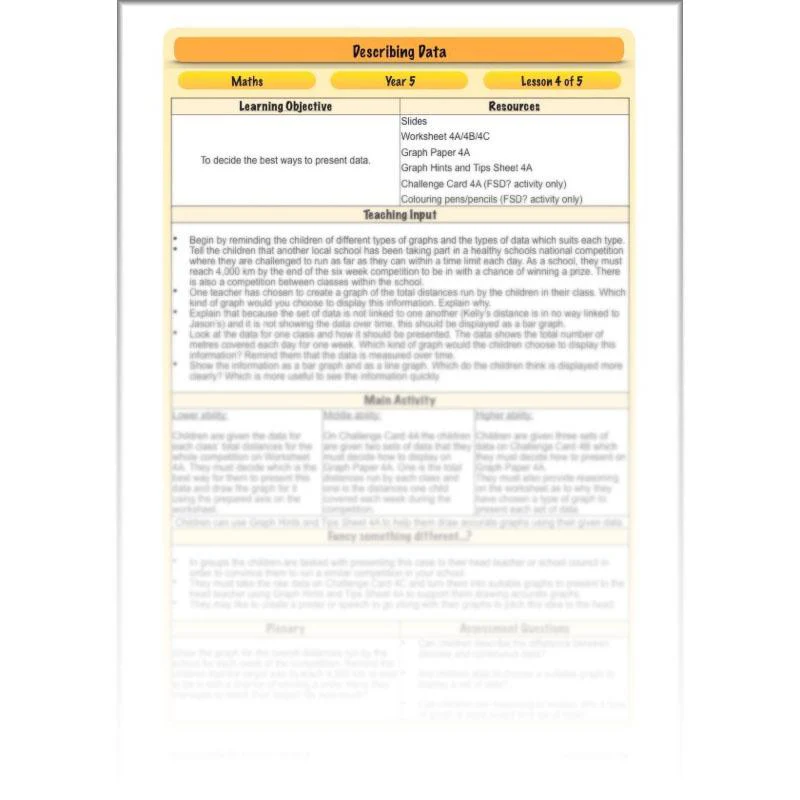
Suitable Graphs and Charts
Focusing on bar charts and line graphs, the children are challenged to think carefully about the data they have and the best way to present the data clearly. They must think about the different types of data and use this to inform their decisions.
This downloadable lesson includes a lesson plan, a slideshow presentation and printable teaching resources.
What's included:
- Lesson plan
- Slides
- Activity ideas
- Differentiated worksheets
- Graph paper
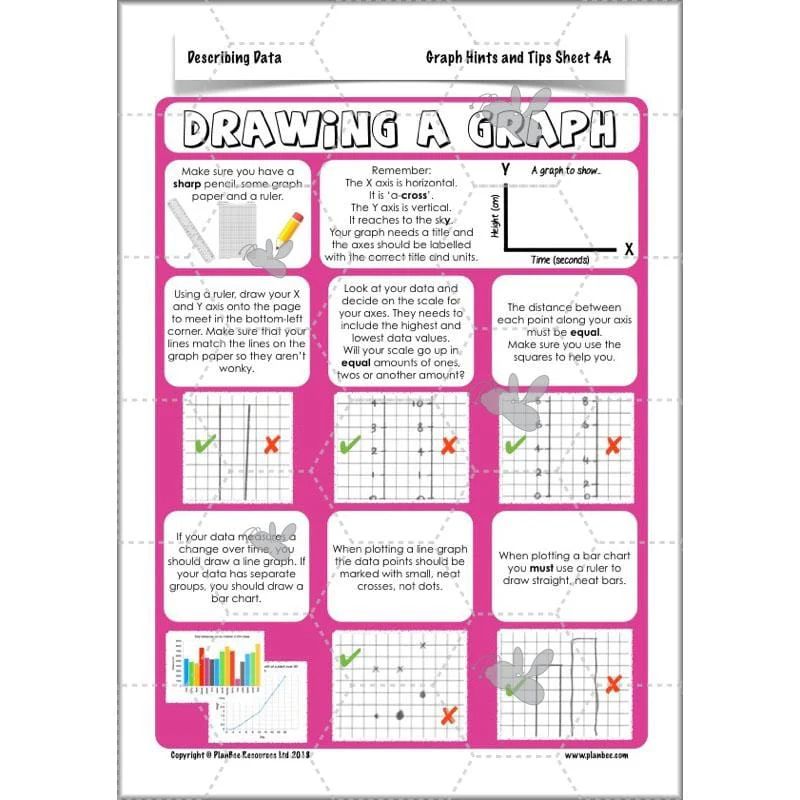
- Graphs ‘hints and tips’ sheet
- Challenge cards
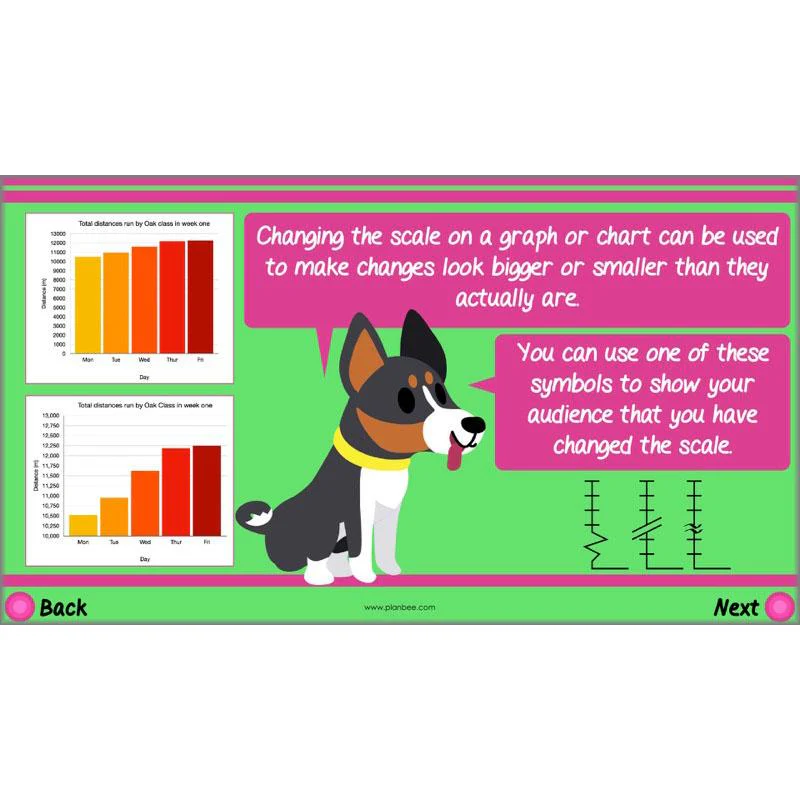
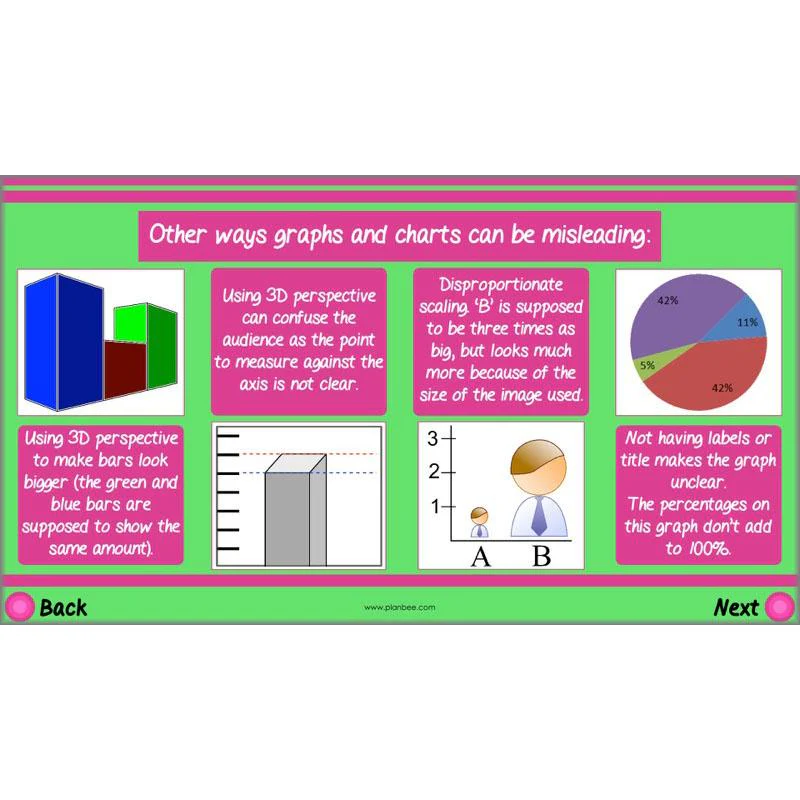
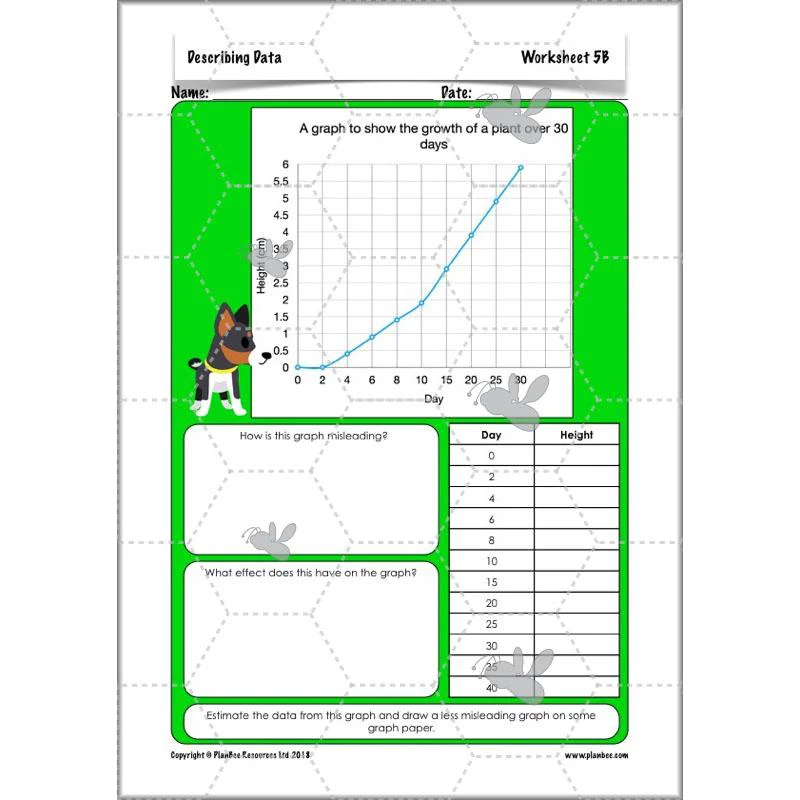
Misleading Graphs and Charts
Instigate some deeper-level thinking and understanding as you teach your class how graphs and charts can be made to be misleading and manipulate an audience into seeing the data differently. The children must use their knowledge of drawing and interpreting scales, bar charts and line graphs to spot how the data can be shown to suit their own purposes.
This downloadable lesson includes a lesson plan, a slideshow presentation and printable teaching resources.
What's included:
- Lesson plan
- Slides
- Activity ideas
- Differentiated worksheets
- Graph cards
- Graph paper
- Challenge cards
Original: $4.65
-65%$4.65
$1.63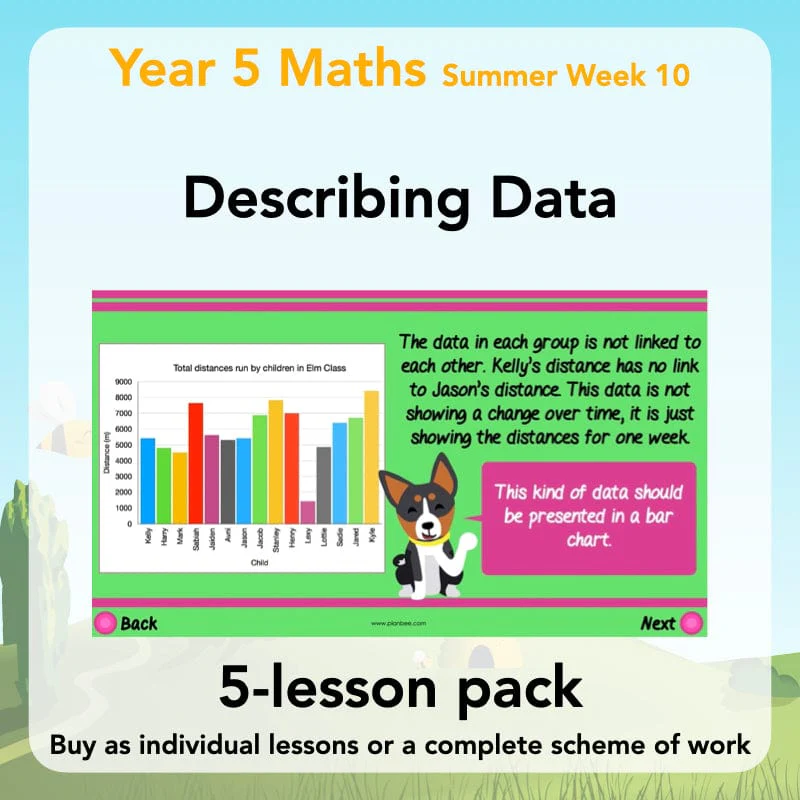


Description
This Year 5 data handling scheme of work focuses on the use of graphs to describe the data they present. The children will look in detail at how information is presented using tables, bar charts and line graphs and the ways in which these presentations can tell the story of the data as well as how they can be manipulated to convey a desired message.
This downloadable series of lessons includes lesson plans, slideshow presentations and printable teaching resources.
Tricky tables
This first lesson challenges the children to master their understanding of data in tables and use this to pick out desired information. They must look carefully for key information within tables and use this to complete the missing data.
This downloadable lesson includes a lesson plan, a slideshow presentation and printable teaching resources.
What's included:
- Lesson plan
- Slides
- Activity ideas
- Differentiated worksheets
- Information tables
- Flashcard templates
Line Graph Problems
This lesson gives the children the opportunity to practise and master their skills when interpreting information in a graph. They have the opportunity to read simple information from line graphs as well as using them to predict future data and come to conclusions in response to questions about the data presented.
This downloadable lesson includes a lesson plan, a slideshow presentation and printable teaching resources.
What's included:
- Lesson plan
- Slides
- Activity ideas
- Differentiated worksheets
- Flashcard templates
- Line graphs
- Fact cards
Line Graph Stories
Have your class explore and discover how line graphs can tell a story over time. The children can investigate how the steepness of a line can show different points in a story and use their imaginations to create stories to match lines in a graph.
This downloadable lesson includes a lesson plan, a slideshow presentation and printable teaching resources.
What's included:
- Lesson plan
- Slides
- Activity ideas
- Teacher Card
- Differentiated worksheets
Suitable Graphs and Charts
Focusing on bar charts and line graphs, the children are challenged to think carefully about the data they have and the best way to present the data clearly. They must think about the different types of data and use this to inform their decisions.
This downloadable lesson includes a lesson plan, a slideshow presentation and printable teaching resources.
What's included:
- Lesson plan
- Slides
- Activity ideas
- Differentiated worksheets
- Graph paper
- Graphs ‘hints and tips’ sheet
- Challenge cards
Misleading Graphs and Charts
Instigate some deeper-level thinking and understanding as you teach your class how graphs and charts can be made to be misleading and manipulate an audience into seeing the data differently. The children must use their knowledge of drawing and interpreting scales, bar charts and line graphs to spot how the data can be shown to suit their own purposes.
This downloadable lesson includes a lesson plan, a slideshow presentation and printable teaching resources.
What's included:
- Lesson plan
- Slides
- Activity ideas
- Differentiated worksheets
- Graph cards
- Graph paper
- Challenge cards