Let’s Make Charts
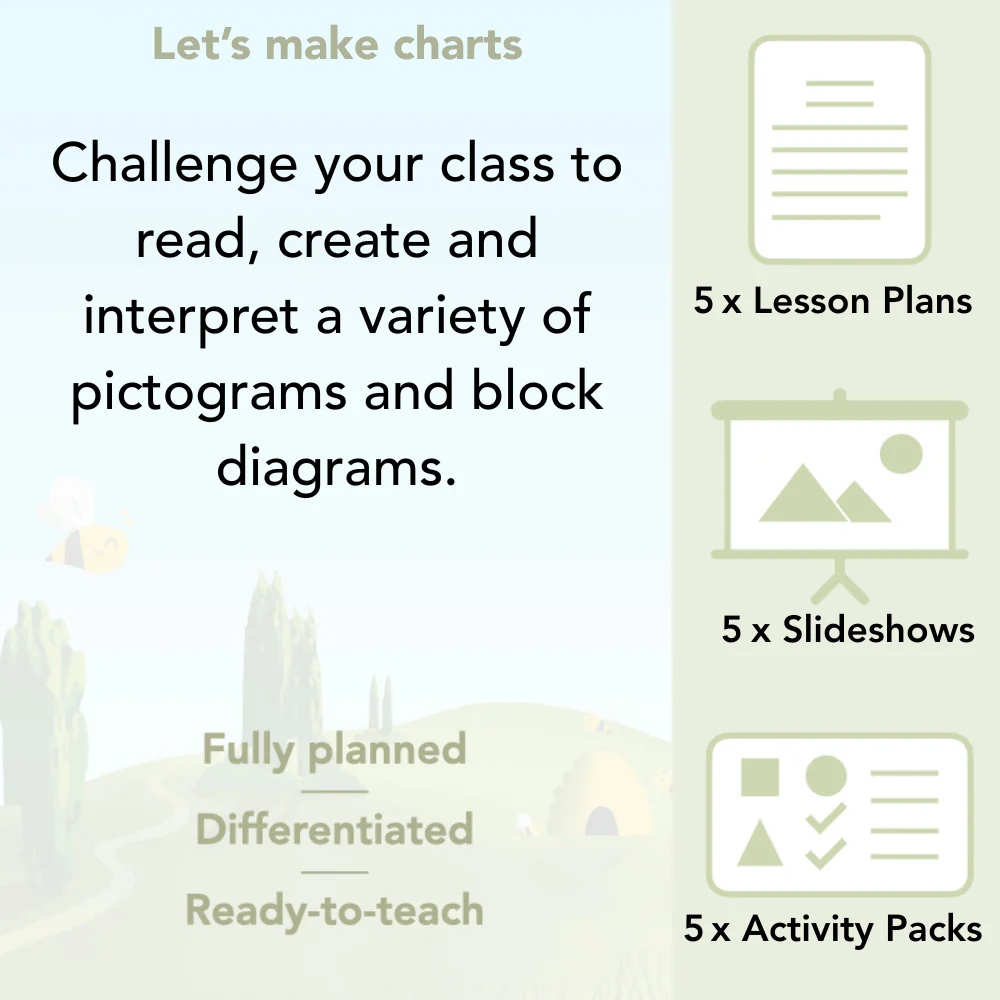
Introduce your class to drawing and interpreting many-to-one pictograms and block diagrams in this complete set of statistics lessons designed for Year 2 classes.
Your class will be challenged to draw and compare pictograms and block diagrams with different keys to identify the different ways that data can be presented using these charts. Give your class the opportunity to collect and present their own data using tallying.
This five-lesson scheme of work comes with plans, slides and printable resources giving you (almost!) everything you need to engage your class in these challenging lessons.
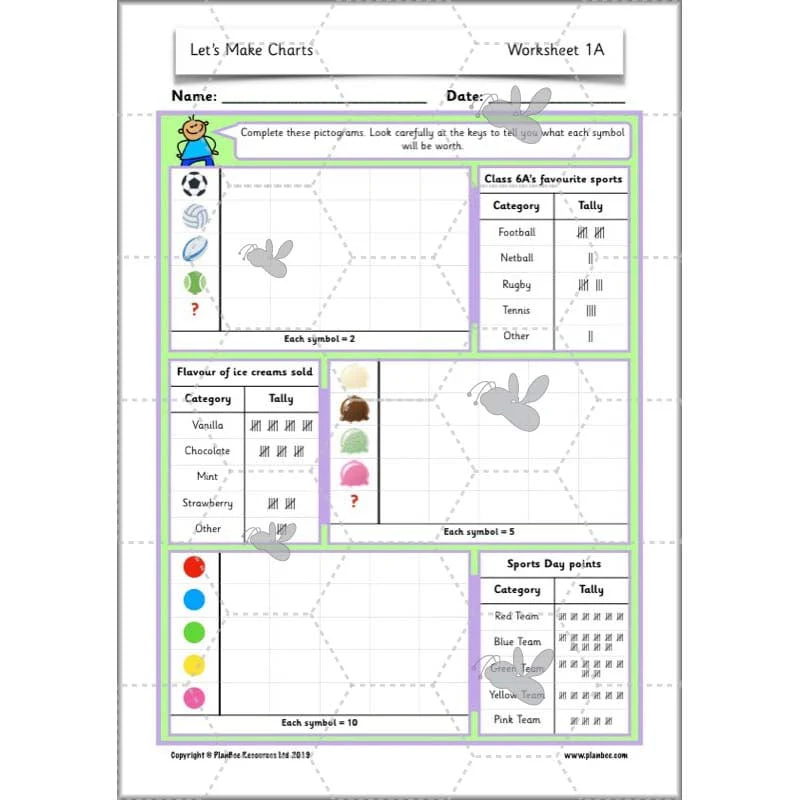
Many-to-One
Introduce your class to pictograms where the symbols are worth more than one piece of data. Children will use their knowledge of tallying and pictograms to read and draw many-to-one charts.
This downloadable lesson comes with a lesson plan, a slideshow presentation and printable teaching resources.
What's included:
- Lesson plan
- Slides
- Activity ideas
- Differentiated worksheets
- Picture cards
- Tally chart cards
- Pictogram cards
- Photo sheet
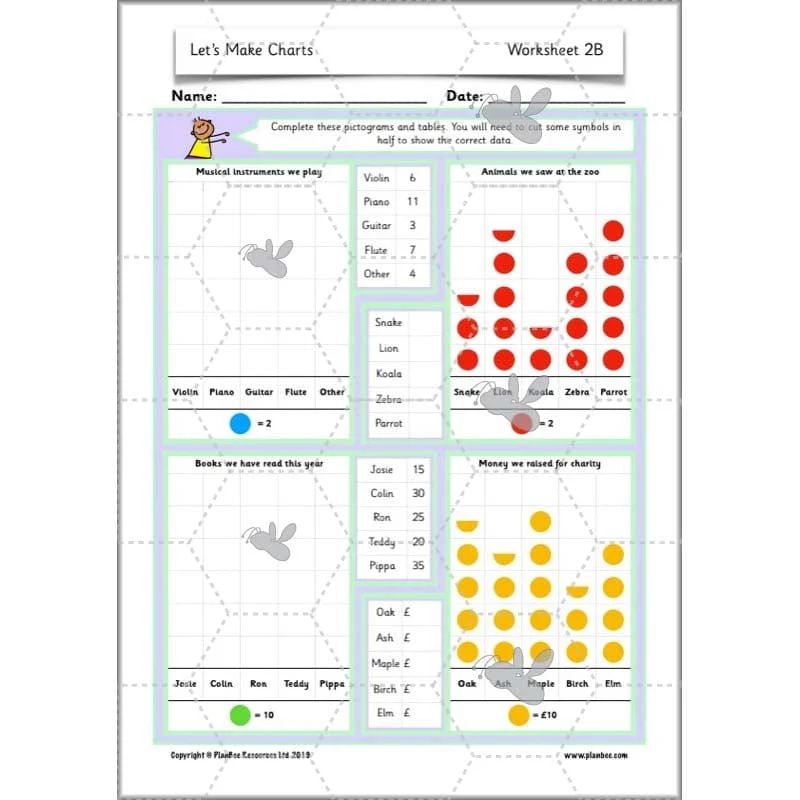
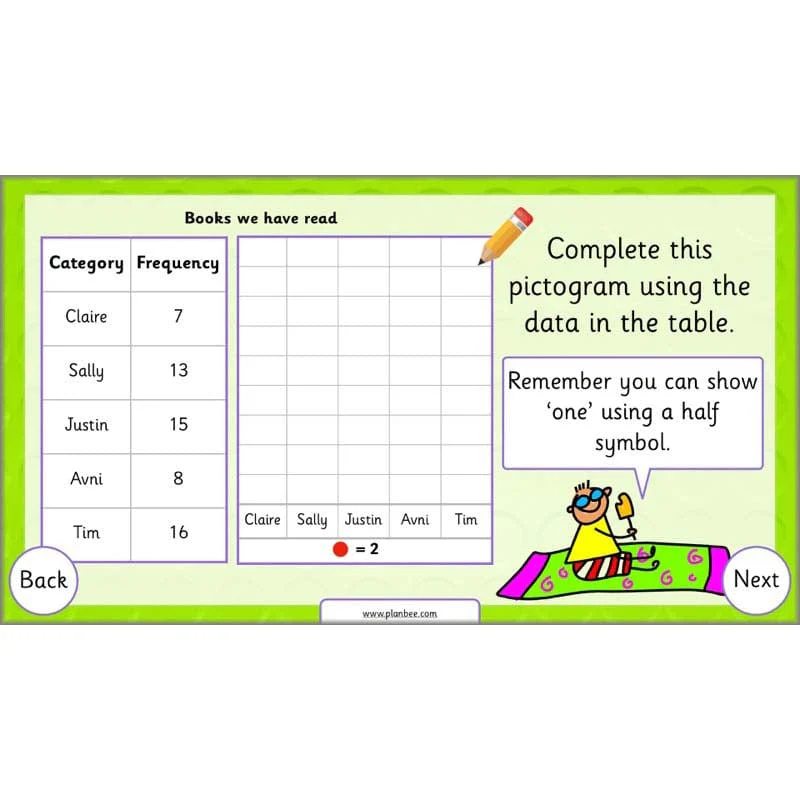
Half Symbols
Challenge your class to interpret pictograms with half symbols and draw their own using given data. Give your class the opportunity to collect their own data using picture books in order to draw a pictogram from their collected data.
This downloadable lesson comes with a lesson plan, a slideshow presentation and printable teaching resources.
What's included:
- Lesson plan
- Slides
- Activity ideas
- Differentiated worksheets
- Picture cards
- Photo sheet
- Chart sheet
Reasoning
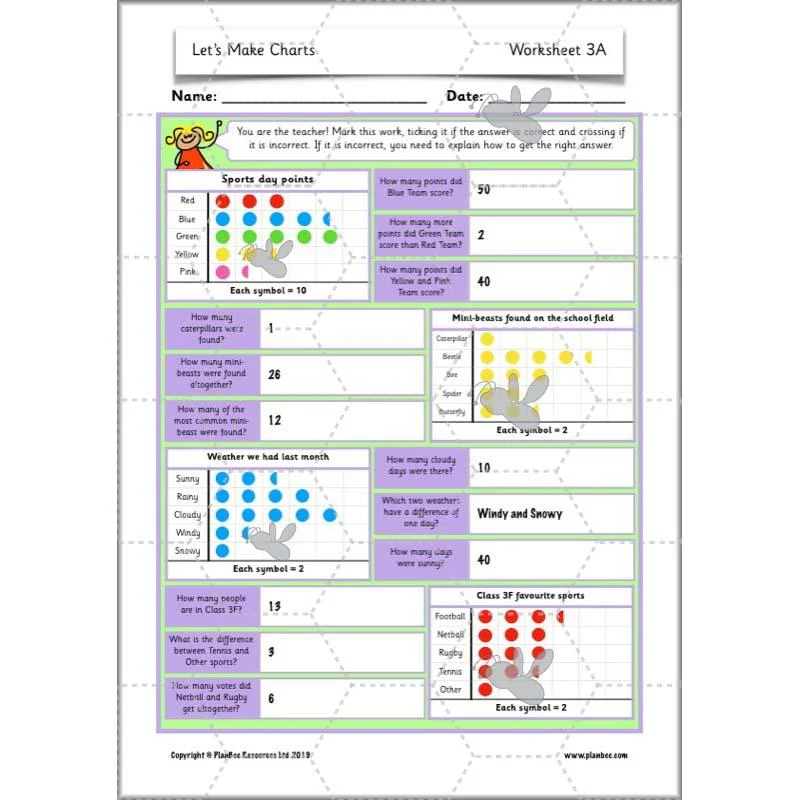
Challenge your class to develop their reasoning skills as they interpret many-to-one pictograms. Encourage your class to explain their answers as they spot mistakes and decide who they agree with when two statements are made about a pictogram.
This downloadable lesson comes with a lesson plan, a slideshow presentation and printable teaching resources.
What's included:
- Lesson plan
- Slides
- Activity ideas
- Differentiated challenge cards
- Worksheet
- Pictogram card
Interpreting Block Diagrams
Challenge your class to interpret tricky block diagrams where blocks have been used to represent multiple pieces of data. Your class will answer tricky questions which require them to take note of the key for each diagram and compare them to other block diagrams.
This downloadable lesson comes with a lesson plan, a slideshow presentation and printable teaching resources.
What's included:
- Lesson plan
- Slides
- Activity ideas
- Differentiated worksheets
- Block diagram sheet
- Statement cards
Collect and Present Data
Guide your class through the process of collecting data using a tally chart and then using this to create a pictogram and a block diagram to present the data. Challenge them to come up with their own categories and figure out the most efficient way of gathering data.
This downloadable lesson comes with a lesson plan, a slideshow presentation and printable teaching resources.
What's included:
- Lesson plan
- Slides
- Activity ideas
- Differentiated worksheets
- Tally chart
- Chart sheet
Original: $4.65
-65%$4.65
$1.63


Description
Introduce your class to drawing and interpreting many-to-one pictograms and block diagrams in this complete set of statistics lessons designed for Year 2 classes.
Your class will be challenged to draw and compare pictograms and block diagrams with different keys to identify the different ways that data can be presented using these charts. Give your class the opportunity to collect and present their own data using tallying.
This five-lesson scheme of work comes with plans, slides and printable resources giving you (almost!) everything you need to engage your class in these challenging lessons.
Many-to-One
Introduce your class to pictograms where the symbols are worth more than one piece of data. Children will use their knowledge of tallying and pictograms to read and draw many-to-one charts.
This downloadable lesson comes with a lesson plan, a slideshow presentation and printable teaching resources.
What's included:
- Lesson plan
- Slides
- Activity ideas
- Differentiated worksheets
- Picture cards
- Tally chart cards
- Pictogram cards
- Photo sheet
Half Symbols
Challenge your class to interpret pictograms with half symbols and draw their own using given data. Give your class the opportunity to collect their own data using picture books in order to draw a pictogram from their collected data.
This downloadable lesson comes with a lesson plan, a slideshow presentation and printable teaching resources.
What's included:
- Lesson plan
- Slides
- Activity ideas
- Differentiated worksheets
- Picture cards
- Photo sheet
- Chart sheet
Reasoning
Challenge your class to develop their reasoning skills as they interpret many-to-one pictograms. Encourage your class to explain their answers as they spot mistakes and decide who they agree with when two statements are made about a pictogram.
This downloadable lesson comes with a lesson plan, a slideshow presentation and printable teaching resources.
What's included:
- Lesson plan
- Slides
- Activity ideas
- Differentiated challenge cards
- Worksheet
- Pictogram card
Interpreting Block Diagrams
Challenge your class to interpret tricky block diagrams where blocks have been used to represent multiple pieces of data. Your class will answer tricky questions which require them to take note of the key for each diagram and compare them to other block diagrams.
This downloadable lesson comes with a lesson plan, a slideshow presentation and printable teaching resources.
What's included:
- Lesson plan
- Slides
- Activity ideas
- Differentiated worksheets
- Block diagram sheet
- Statement cards
Collect and Present Data
Guide your class through the process of collecting data using a tally chart and then using this to create a pictogram and a block diagram to present the data. Challenge them to come up with their own categories and figure out the most efficient way of gathering data.
This downloadable lesson comes with a lesson plan, a slideshow presentation and printable teaching resources.
What's included:
- Lesson plan
- Slides
- Activity ideas
- Differentiated worksheets
- Tally chart
- Chart sheet