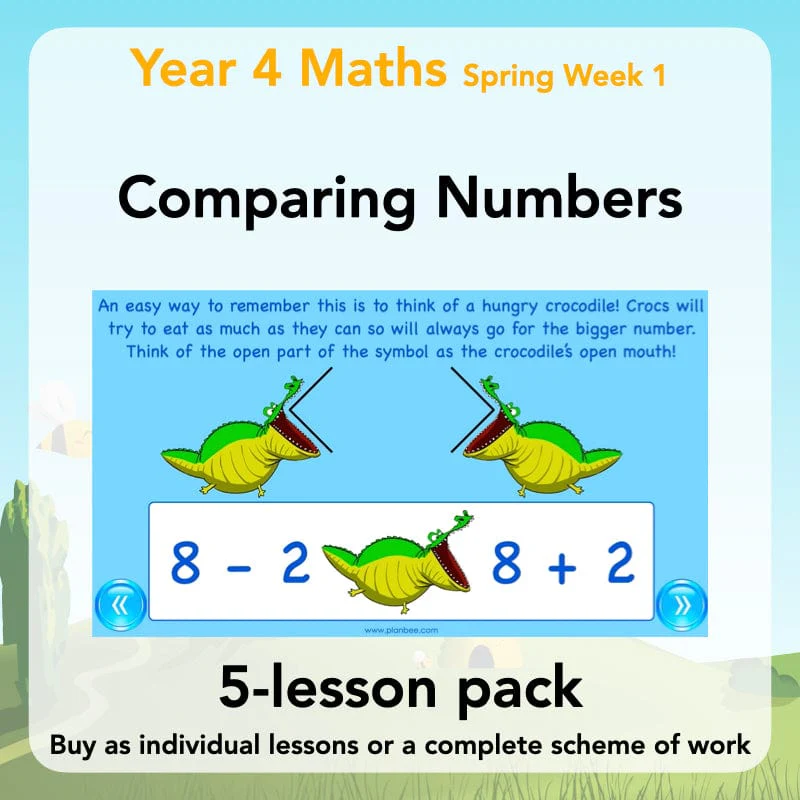
Presenting Data
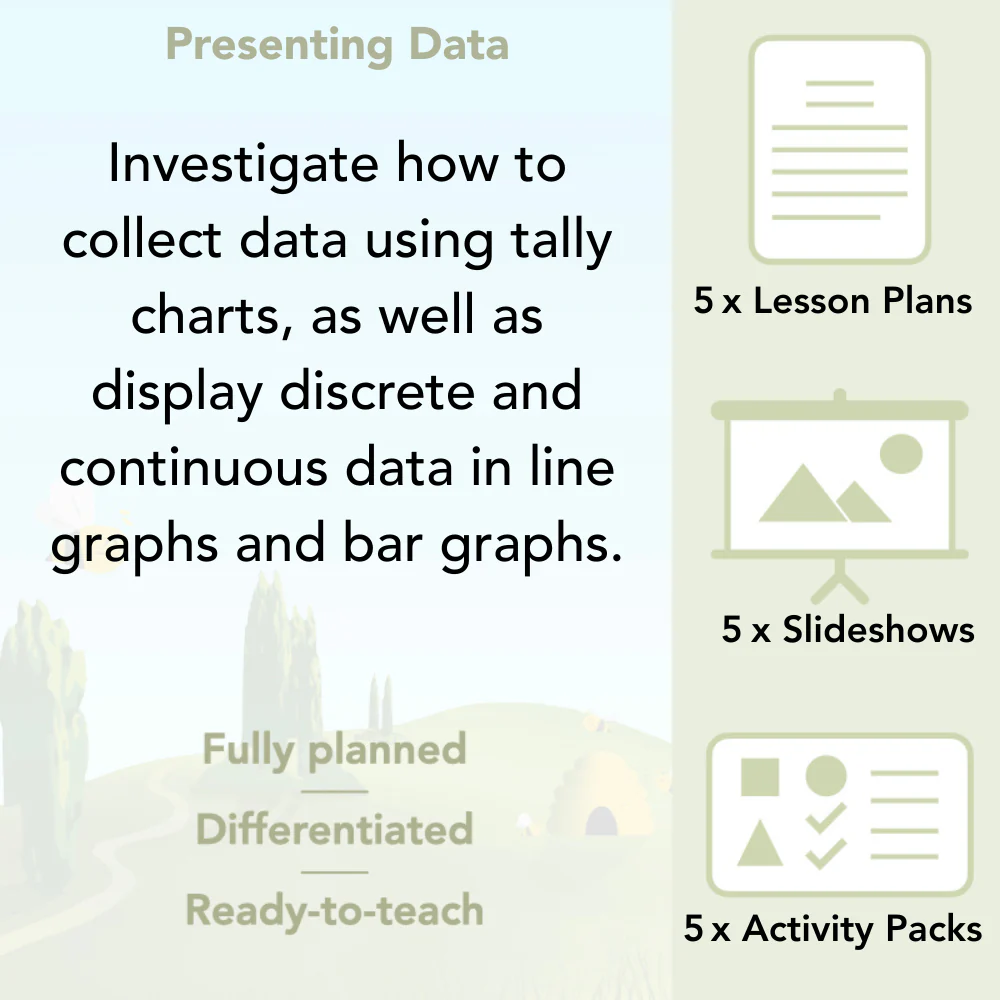
In these complete lessons for Year 4, children will read and interpret data presented in a variety of ways, and generate their own questions which can be answered by studying data.
They will consider how best to both continuous and discrete data using line graphs and bar charts as well as planning surveys and collecting data using tally charts.
With lesson plans, slides, activity ideas, differentiated worksheets and more, these KS2 'Presenting Data' lessons provide all you need to teach your Year 4 class the best ways to present information through a variety of fun activities.
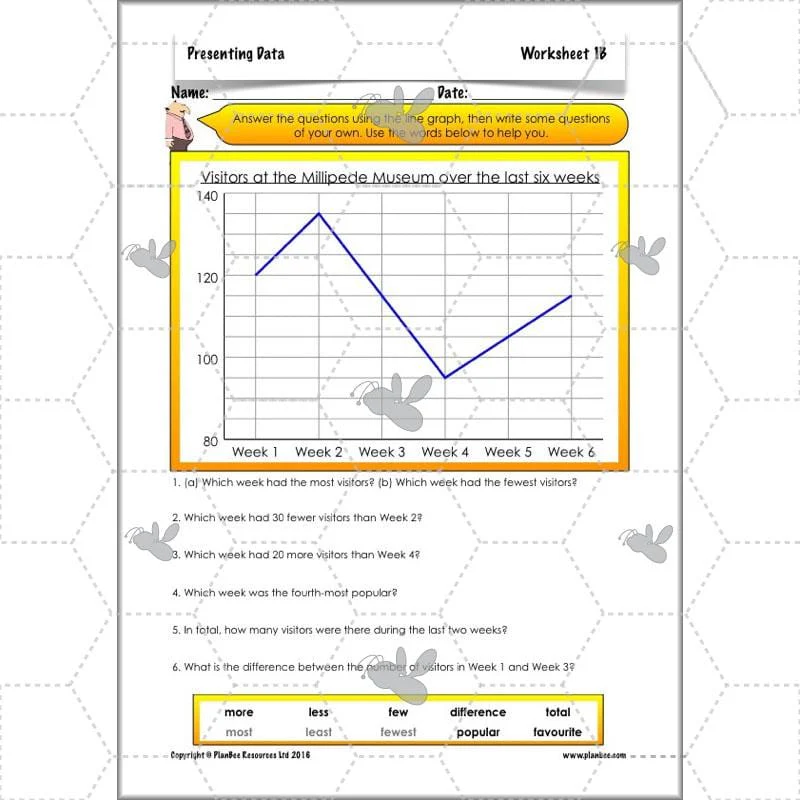
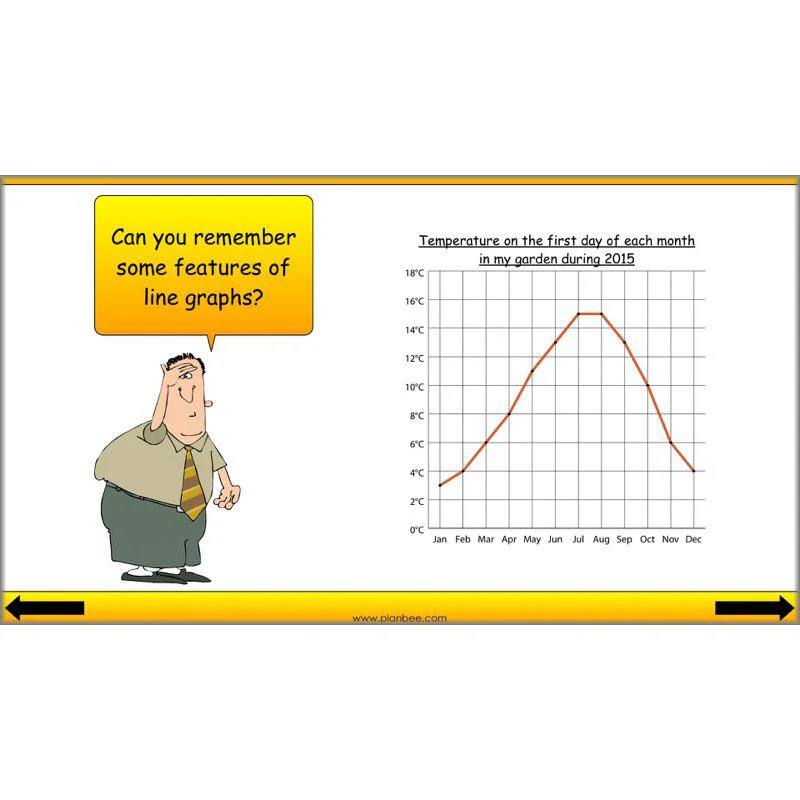
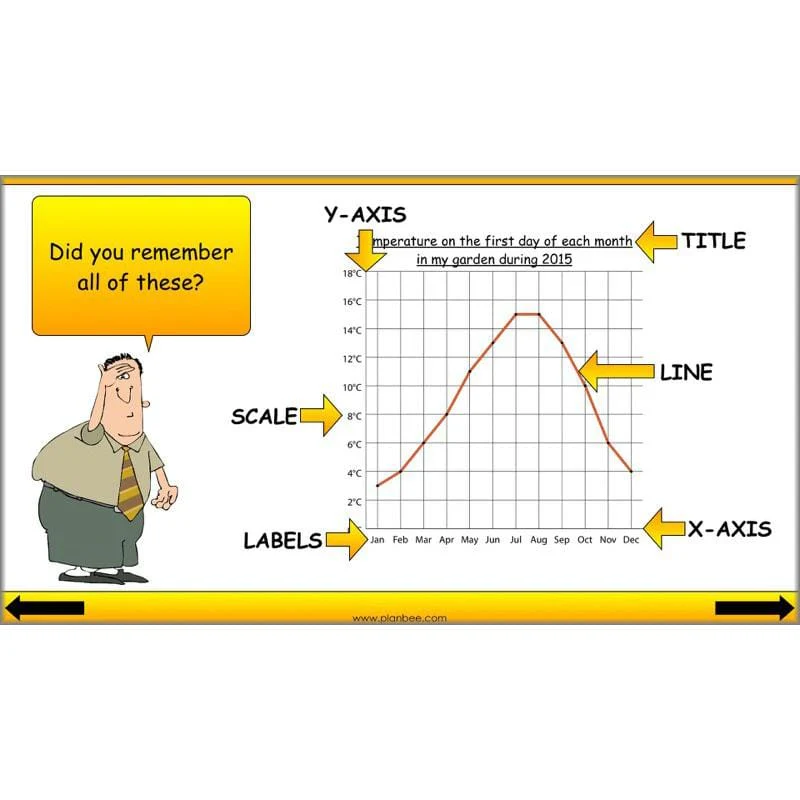
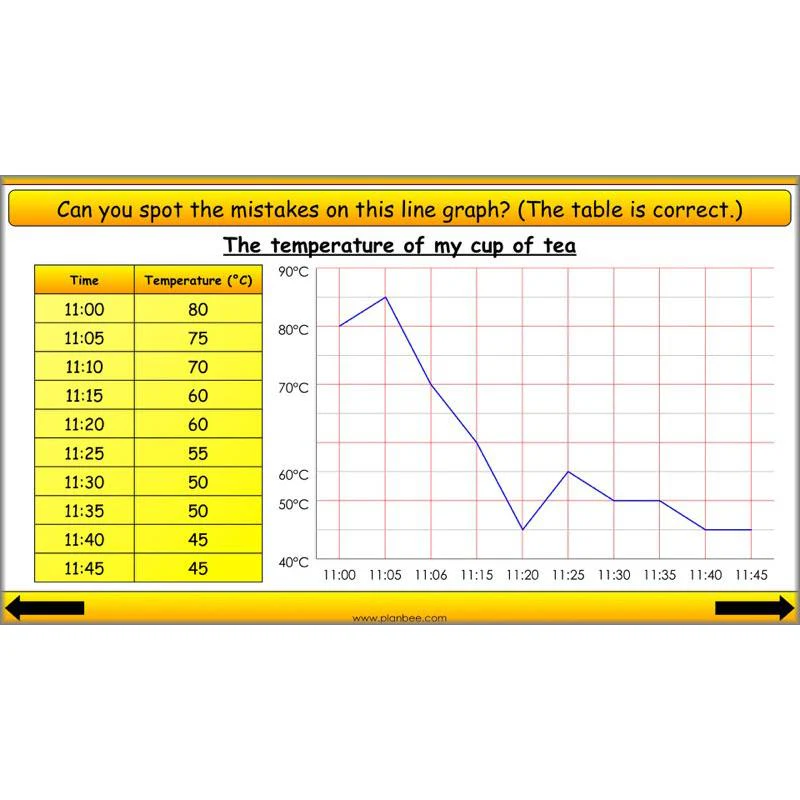
Reading Line Graphs
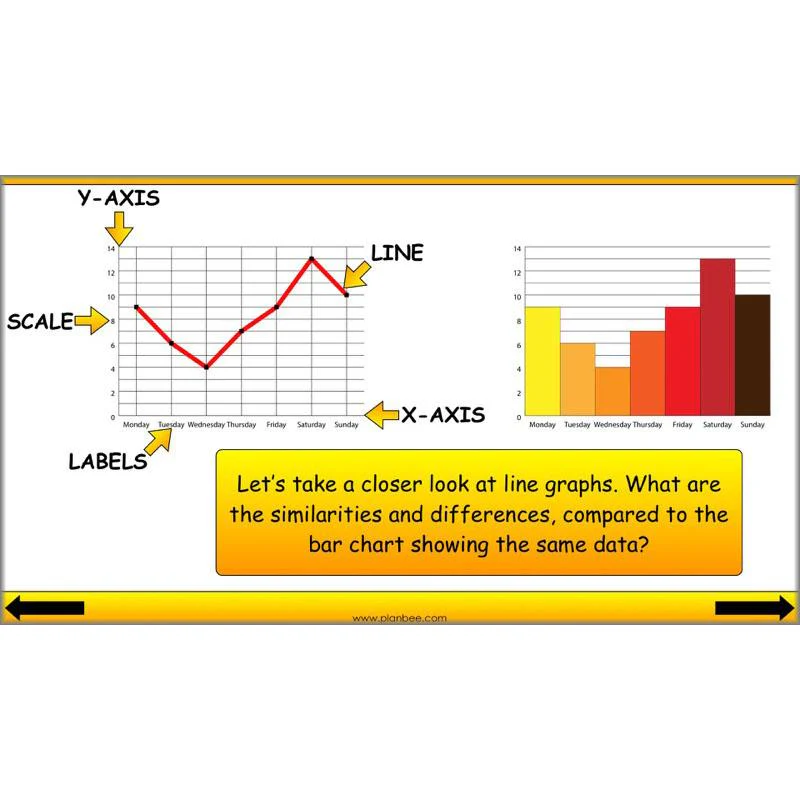
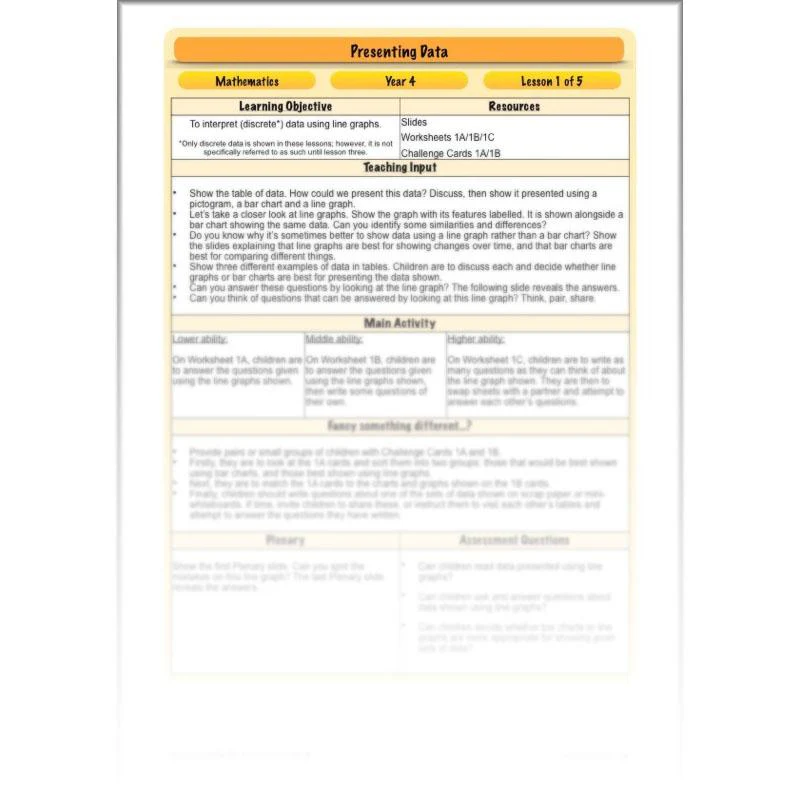
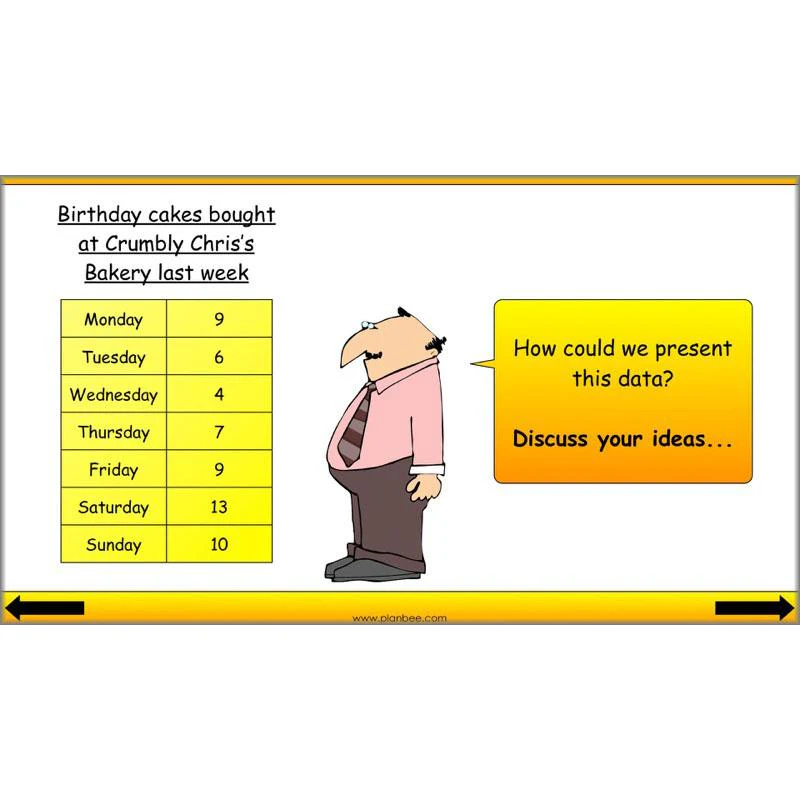
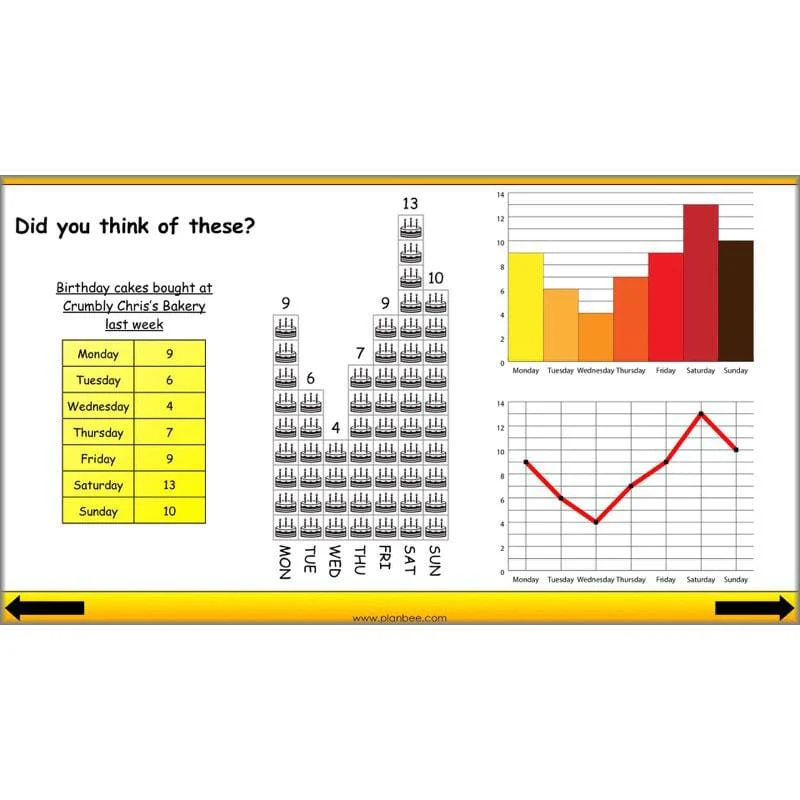
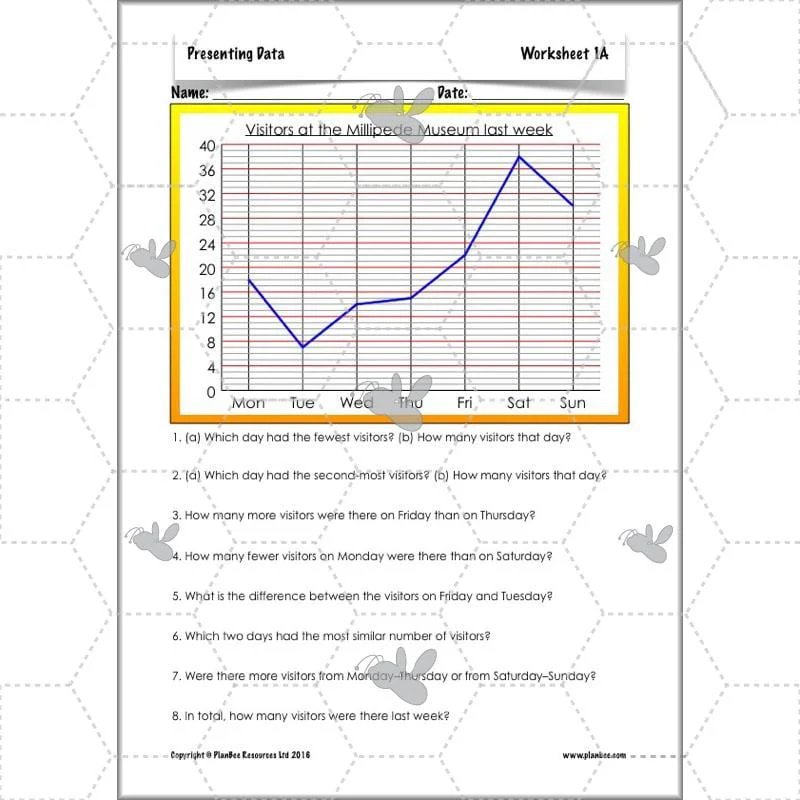
In this lesson, children will consider why line graphs are often preferable to bar charts for showing changes over time. They will look at a number of examples of sets of data and decide on the best way to present them and answer questions about them.
This downloadable lesson includes a lesson plan, slideshow presentation and printable teaching resources.
What's included:
- Lesson plan
- Slides
- Activity ideas
- Differentiated worksheets
- Challenge cards
View Lesson 1
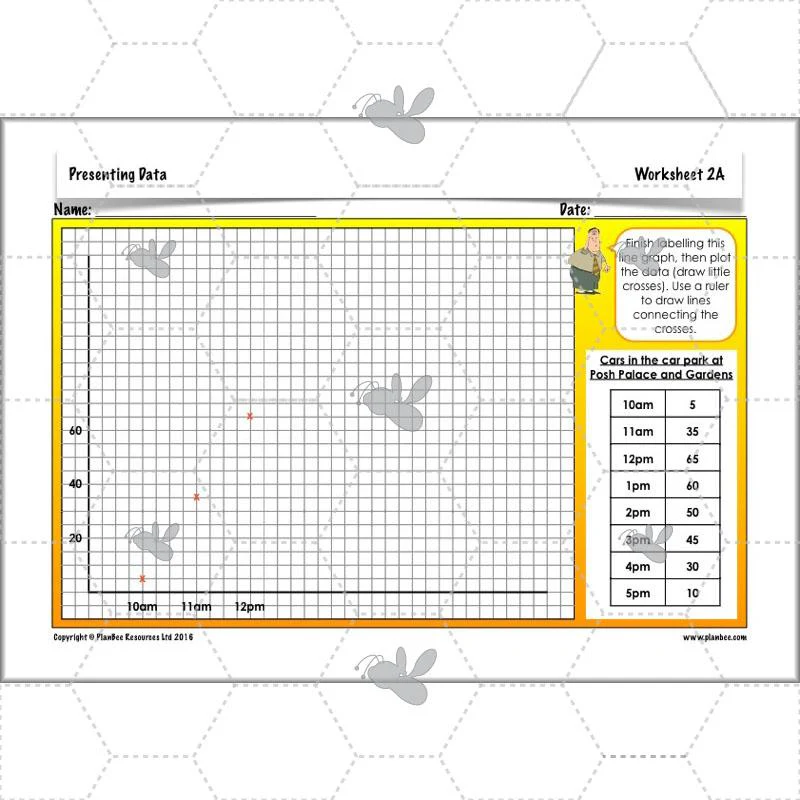
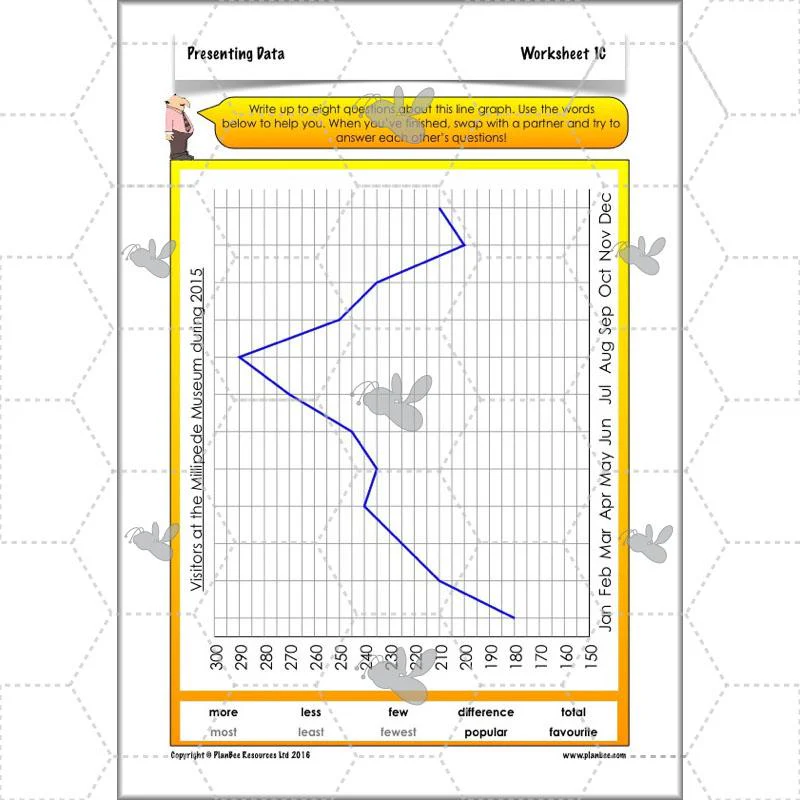
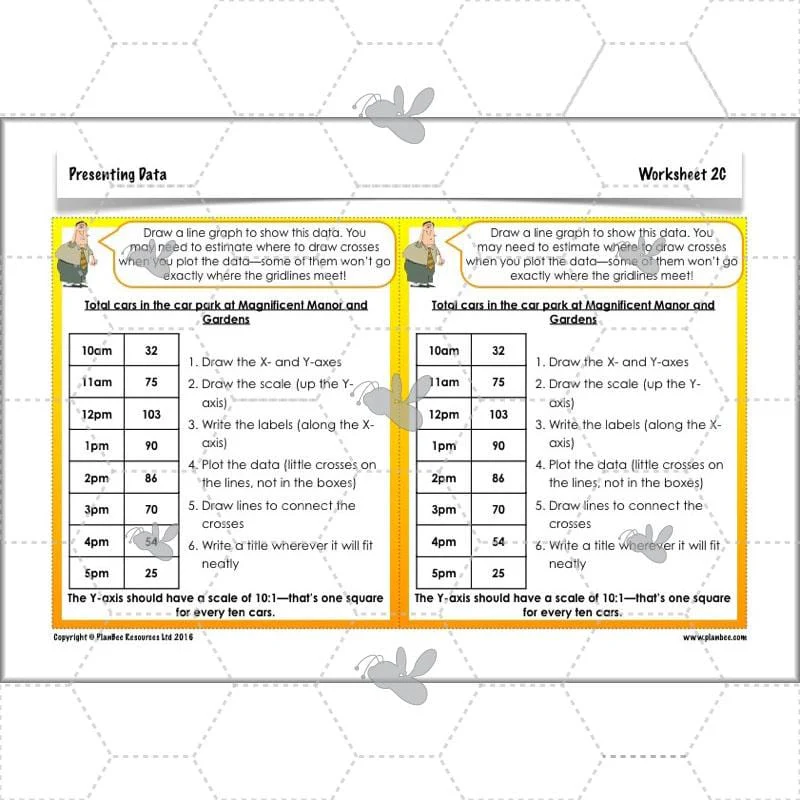
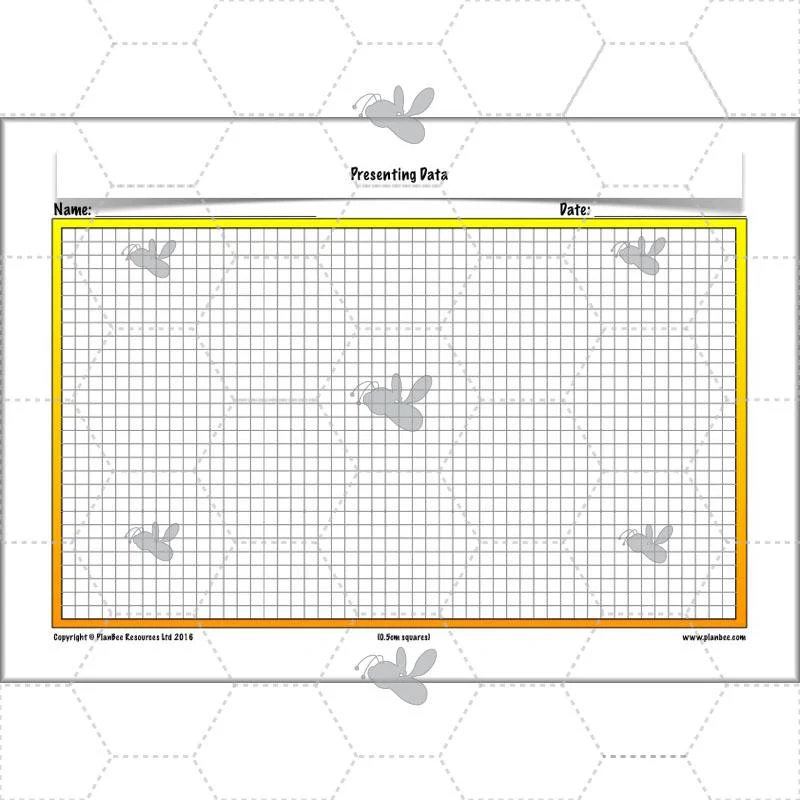
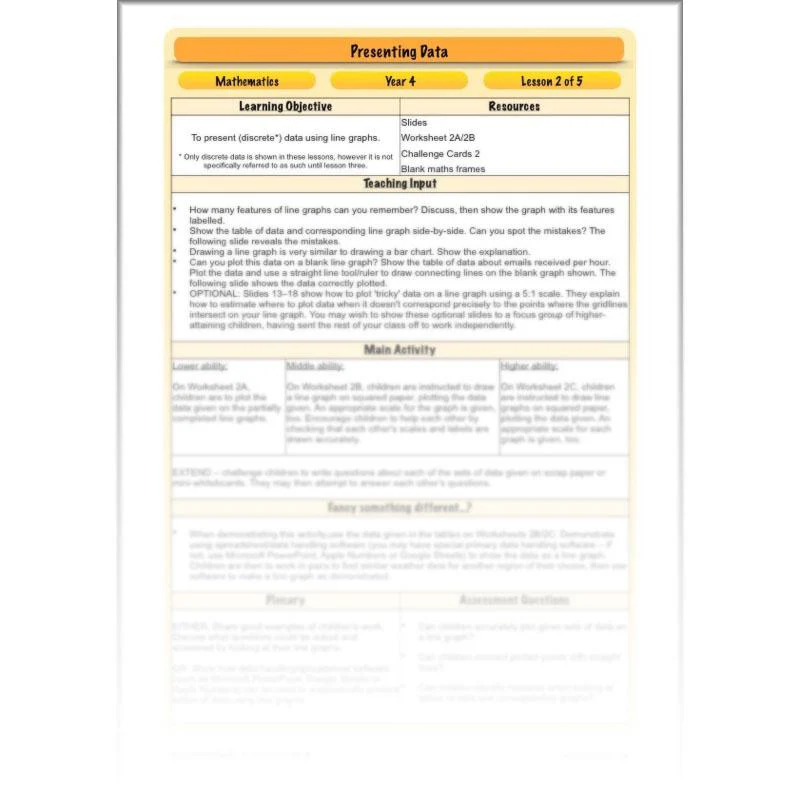
Drawing Line Graphs
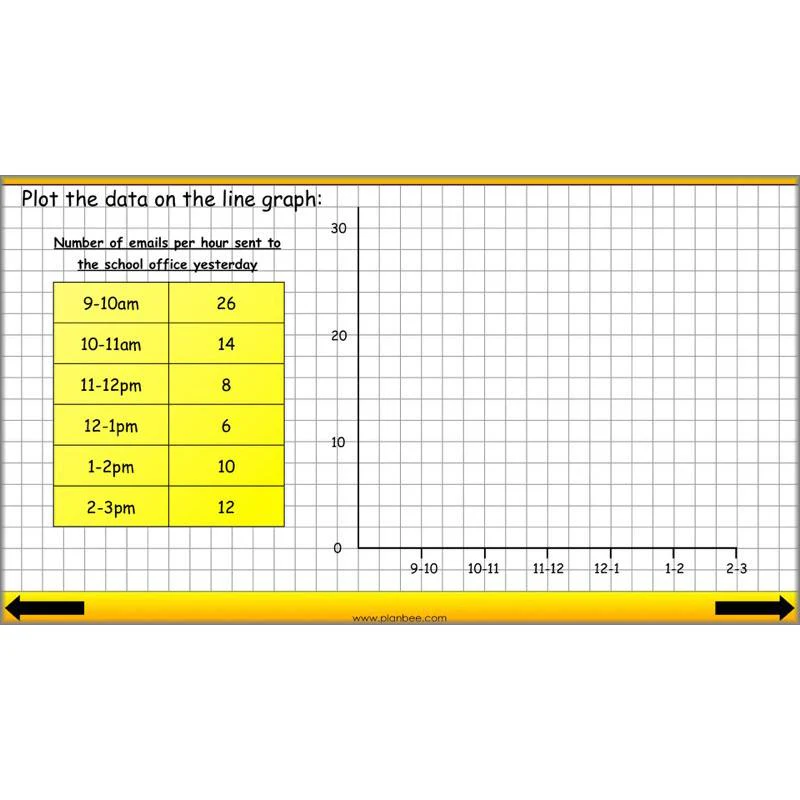
Show children how to draw line graphs and plot data on them, then challenge them to plot given sets of data on partially completed line graphs, or start from scratch on graph paper! In this lesson, the scales for the graphs children will draw are given, so they can focus on drawing and plotting accurately.
This downloadable lesson includes a lesson plan, slideshow presentation and printable teaching resources.
What's included:
- Lesson plan
- Slides
- Activity ideas
- Differentiated worksheets
- Blank maths frames
View Lesson 2
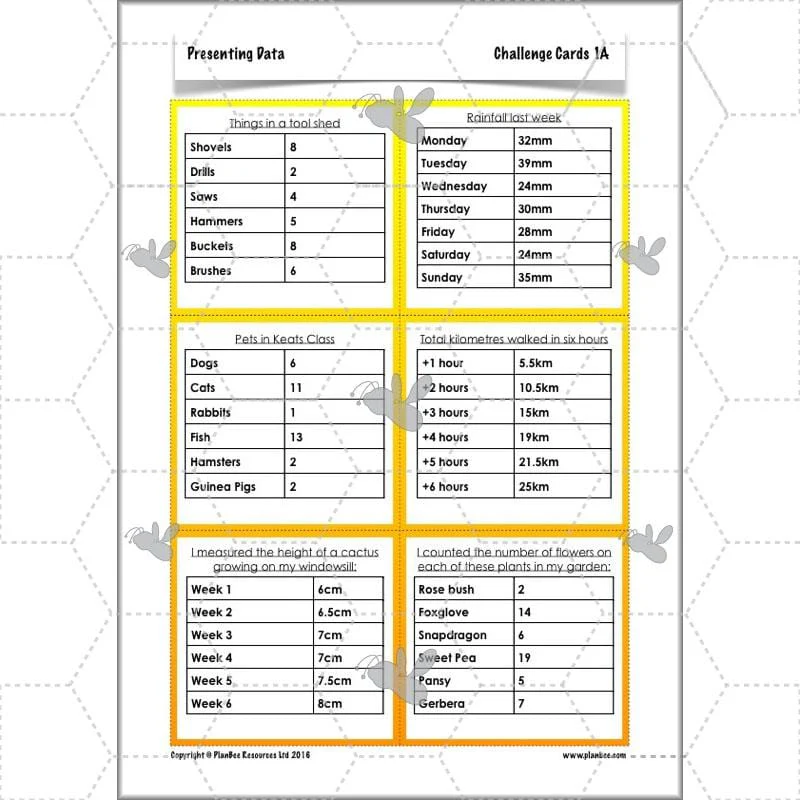
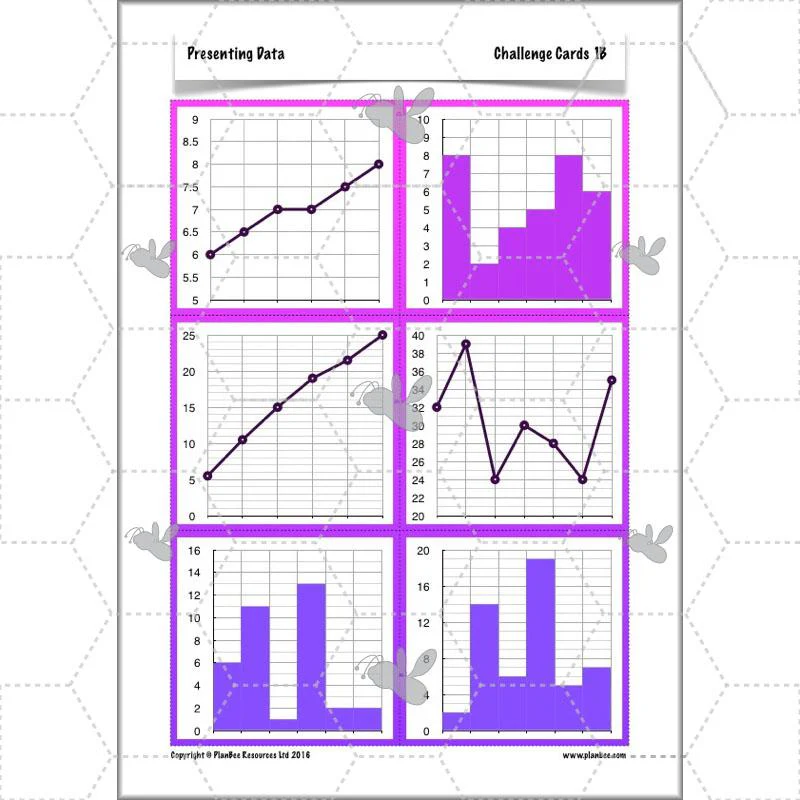
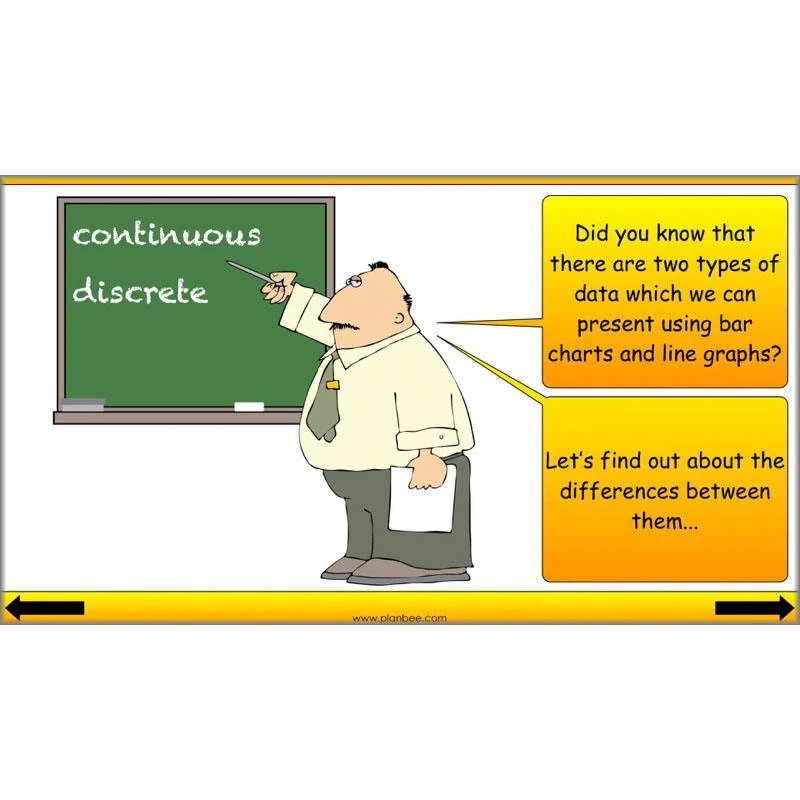
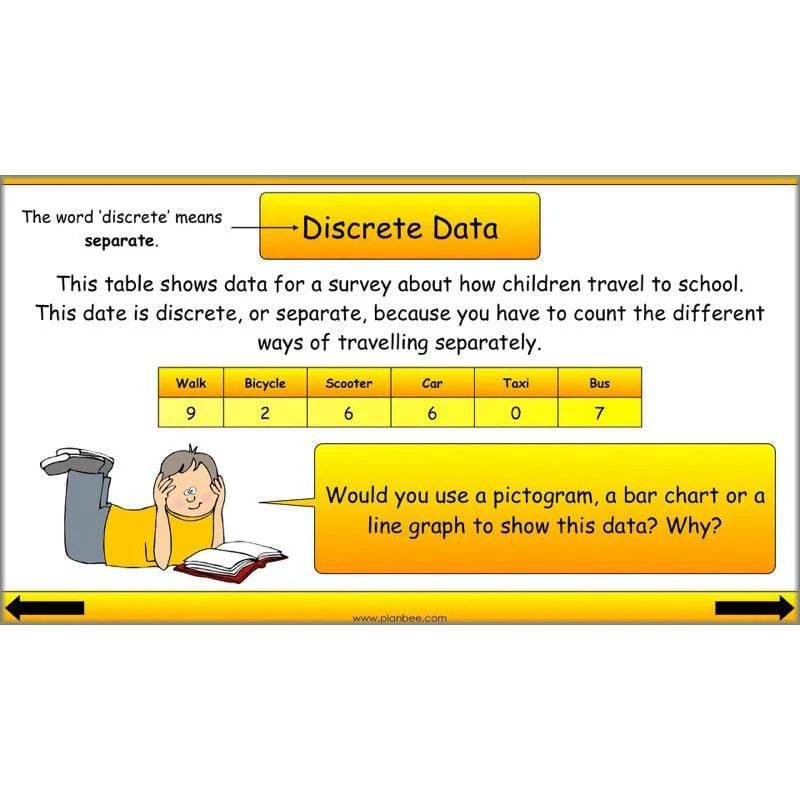
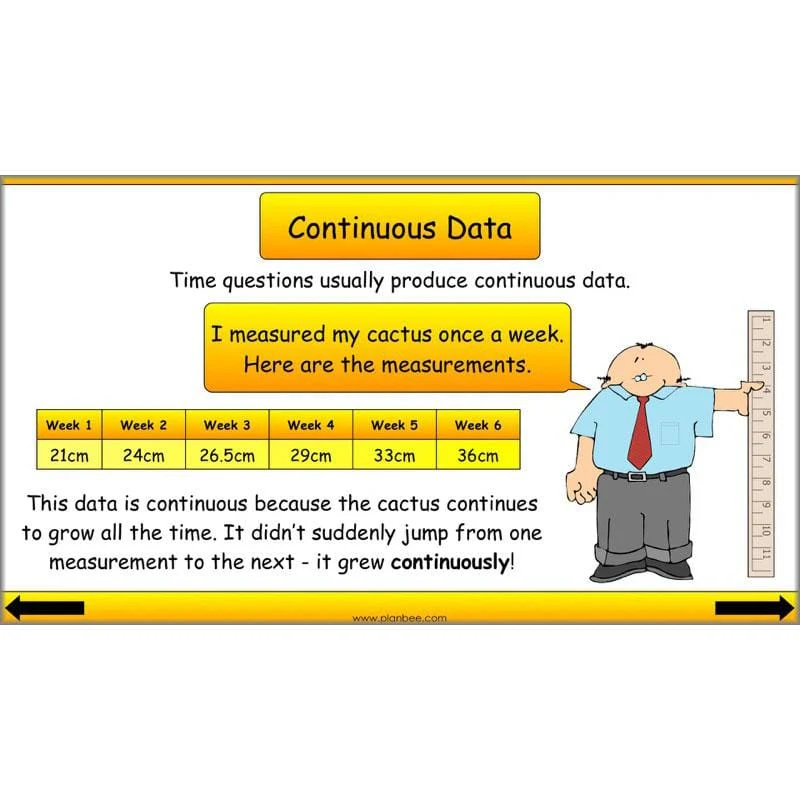
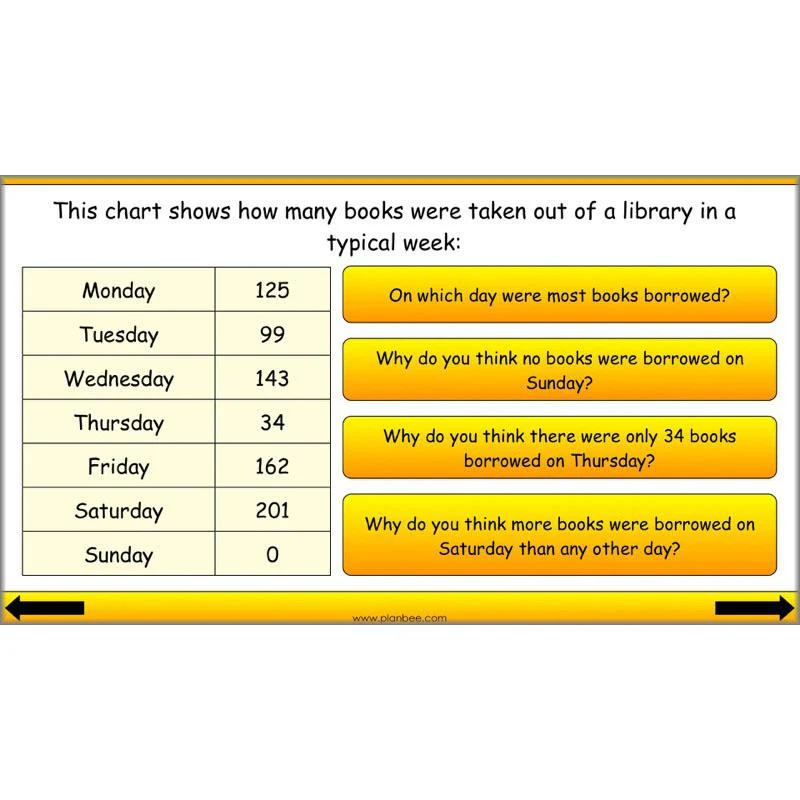
Continuous Data
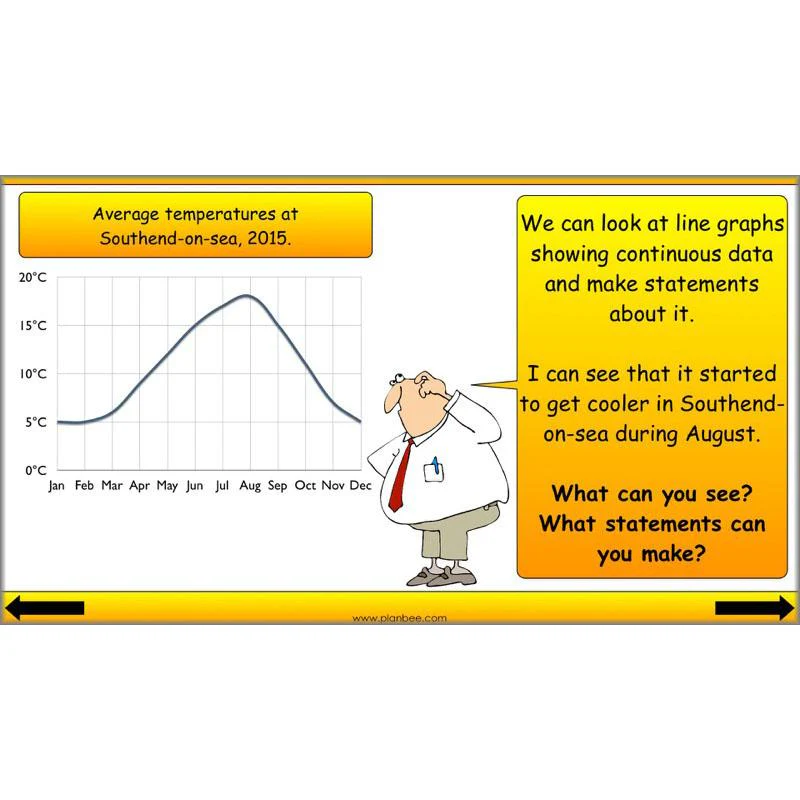
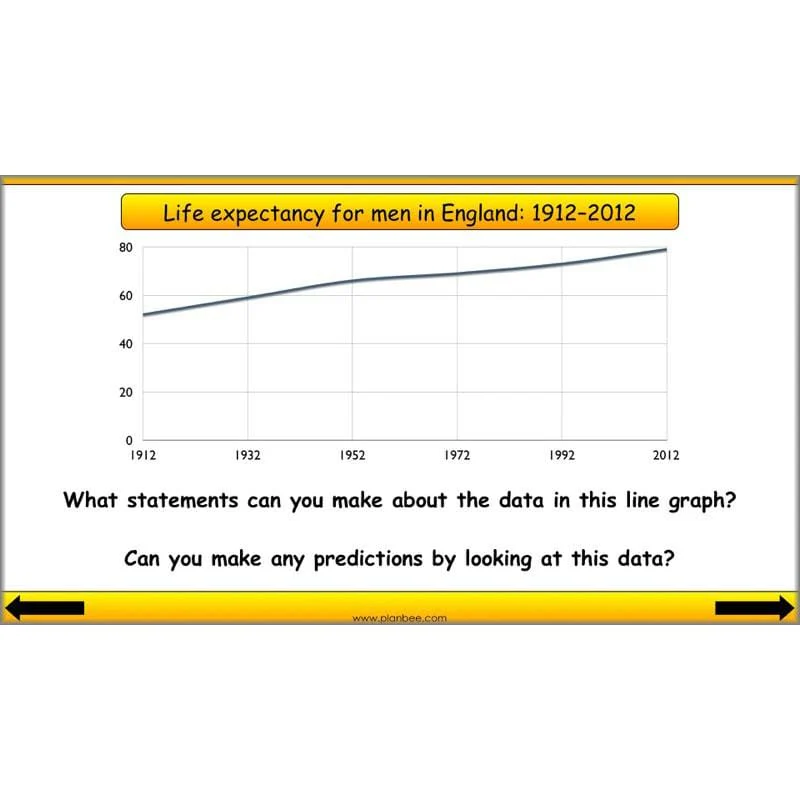
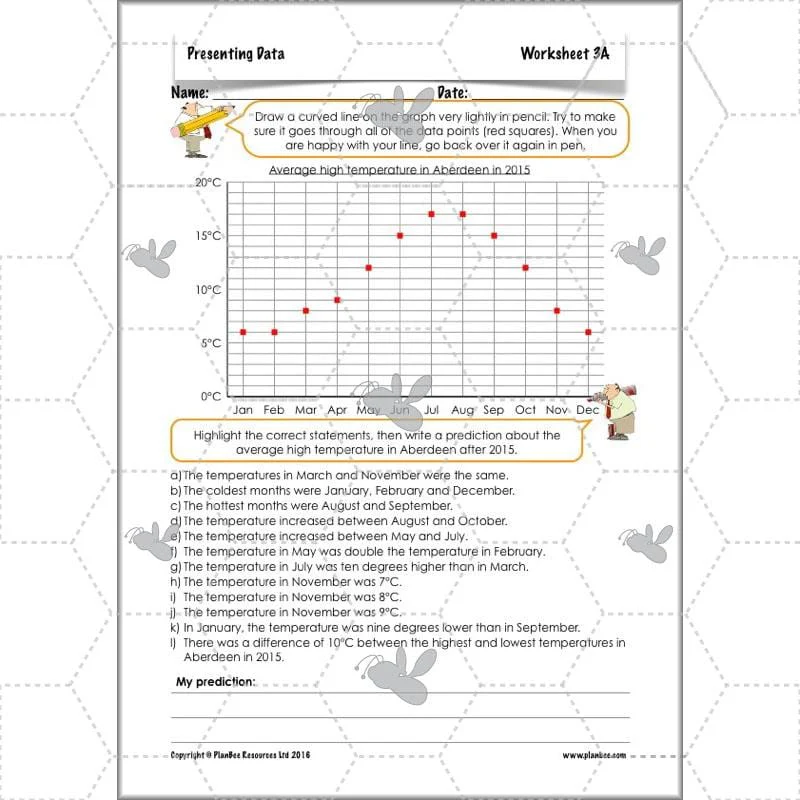
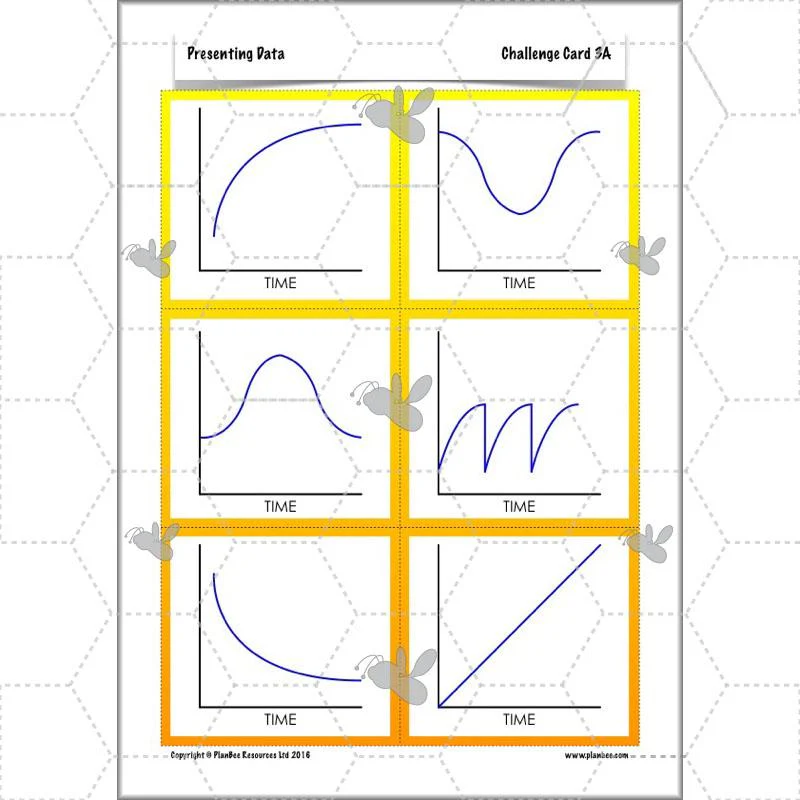
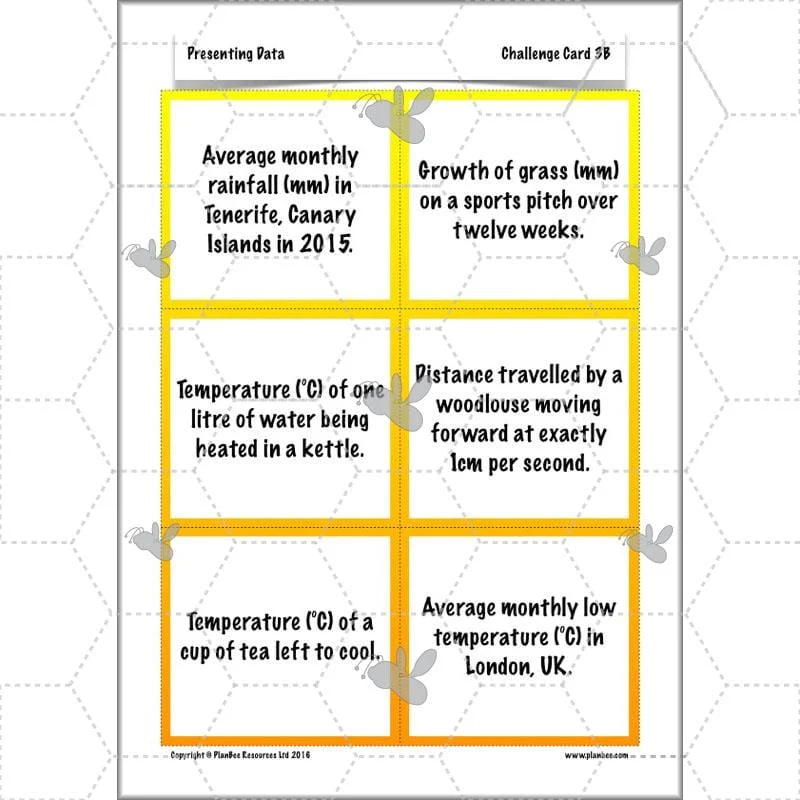
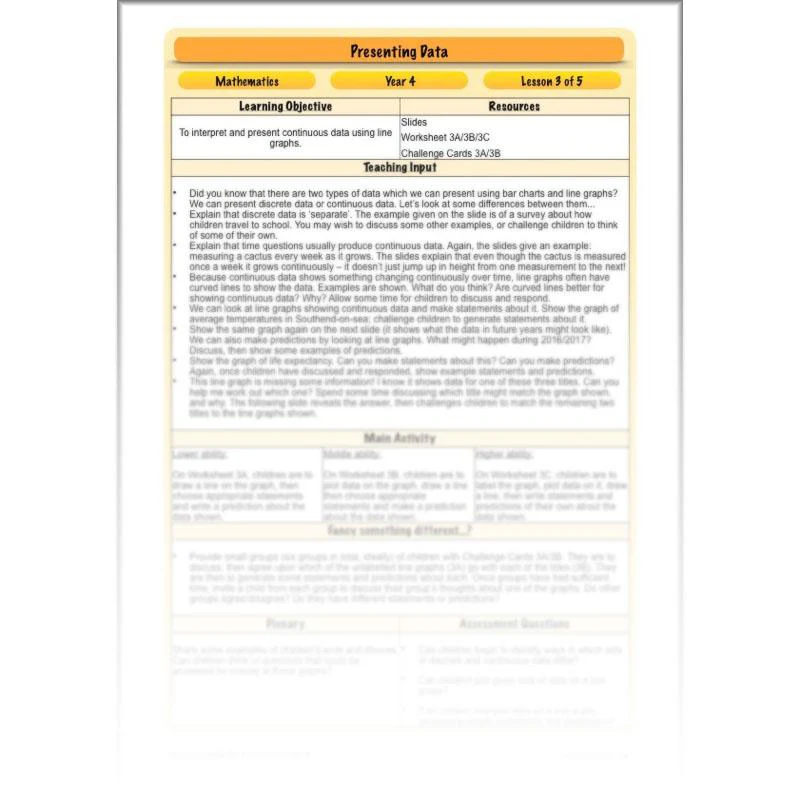
Building on the learning of the previous two lessons in this scheme of work, the included slides explain some differences between continuous and discrete data, giving examples. Children are challenged to not only read and interpret data on line graphs, but predict trends based on the given data. Following this, children may either practise plotting continuous data, or look at unlabelled line graphs, suggesting what kind of data they might show.
This downloadable lesson includes a lesson plan, slideshow presentation and printable teaching resources.
What's included:
- Lesson plan
- Slides
- Activity ideas
- Differentiated worksheets
- Challenge cards
View Lesson 3
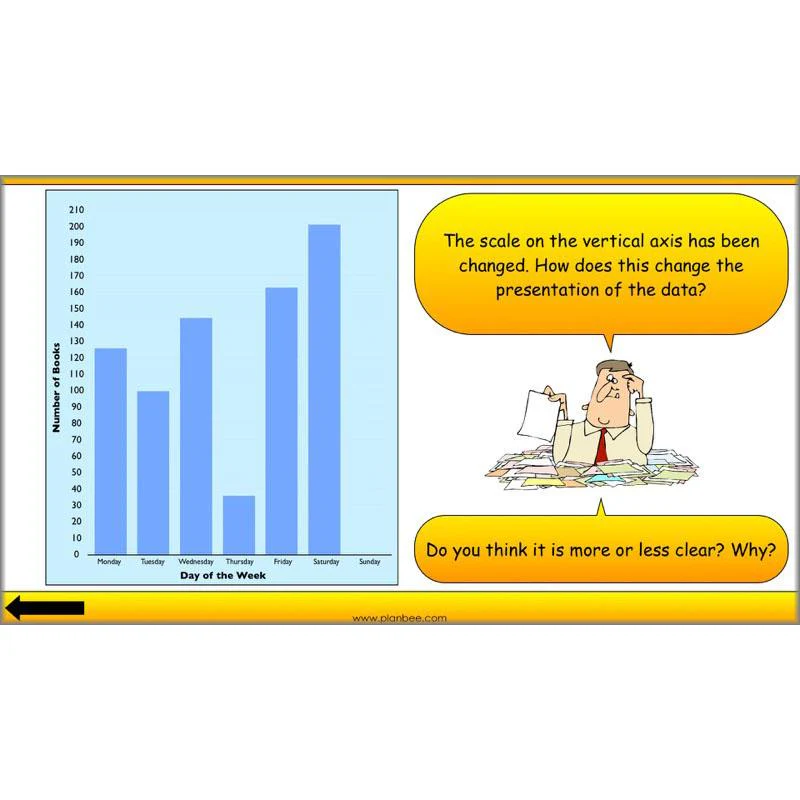
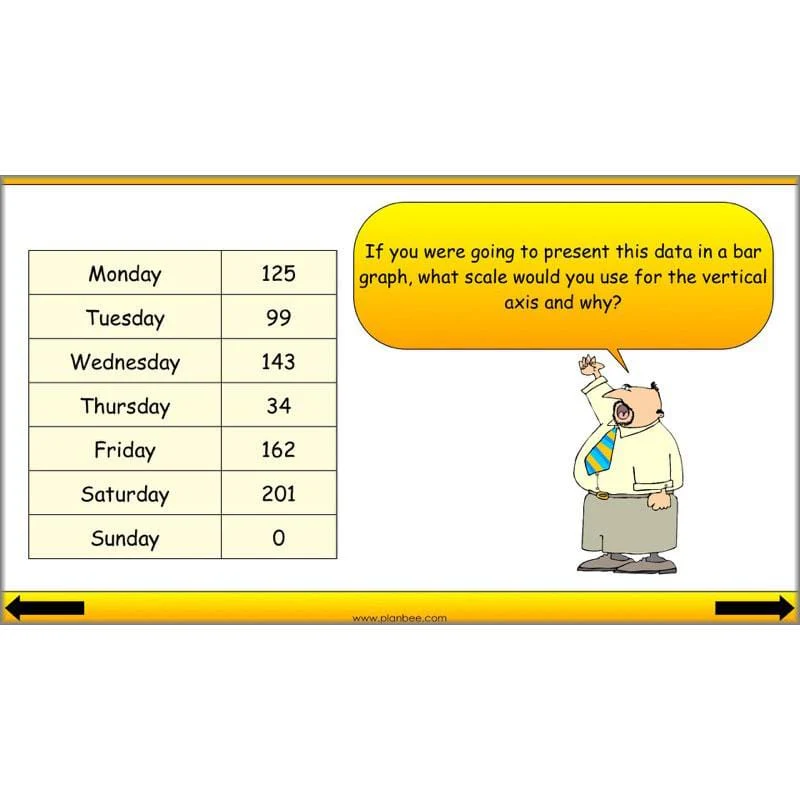
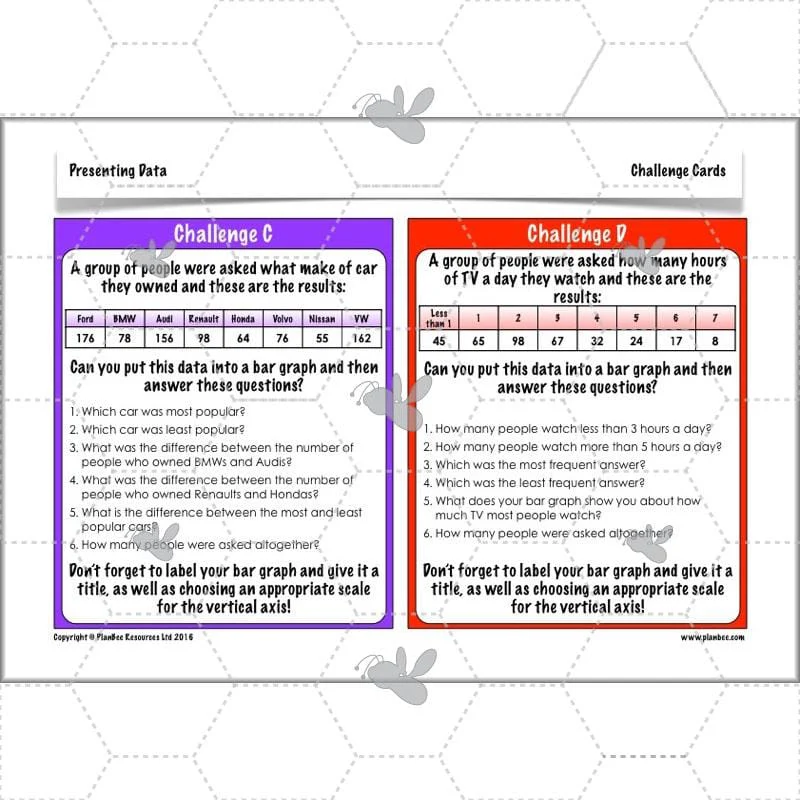
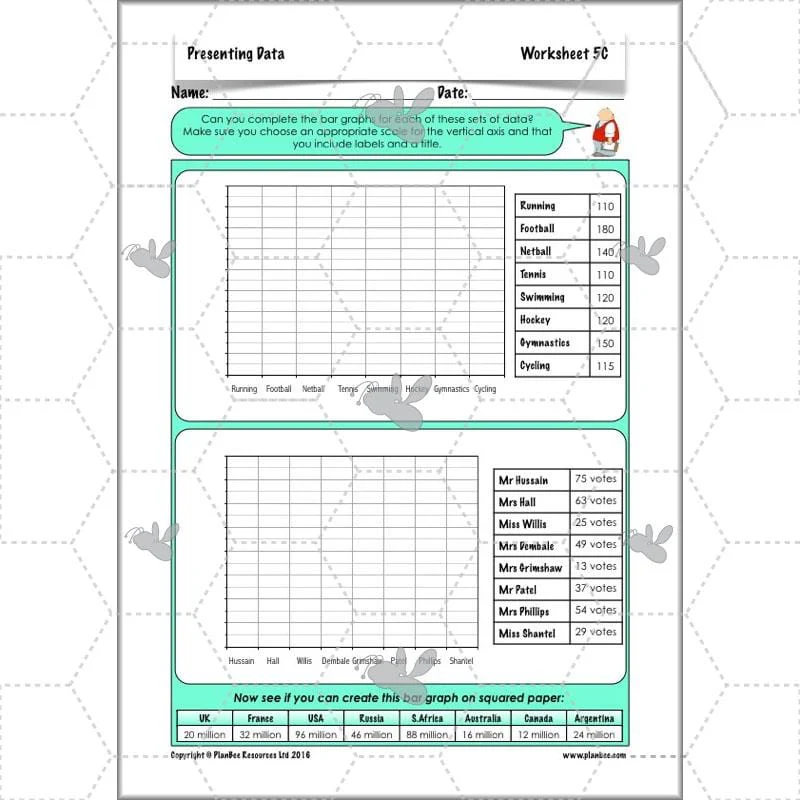
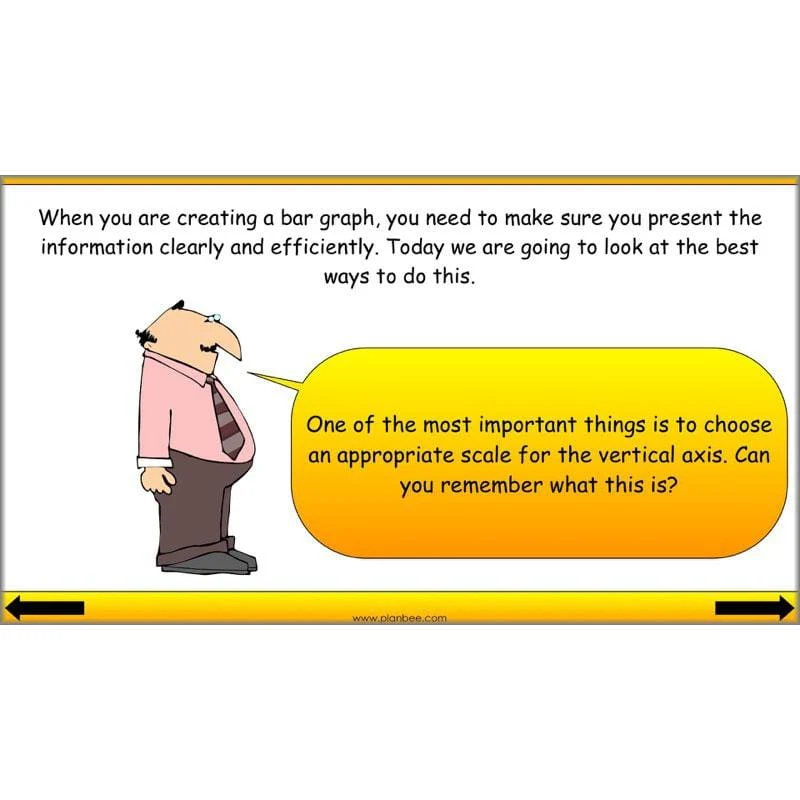
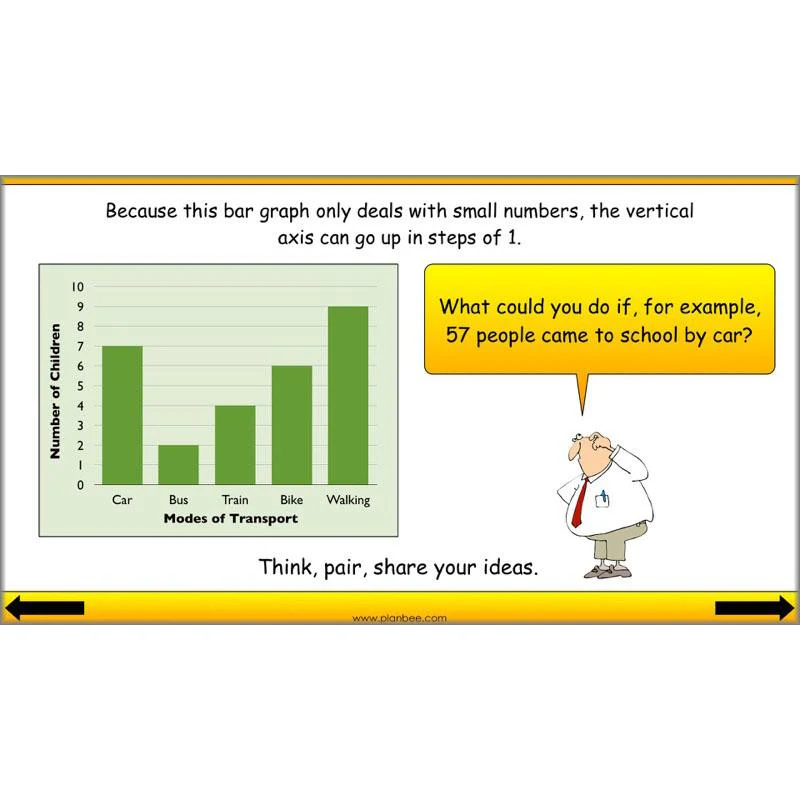
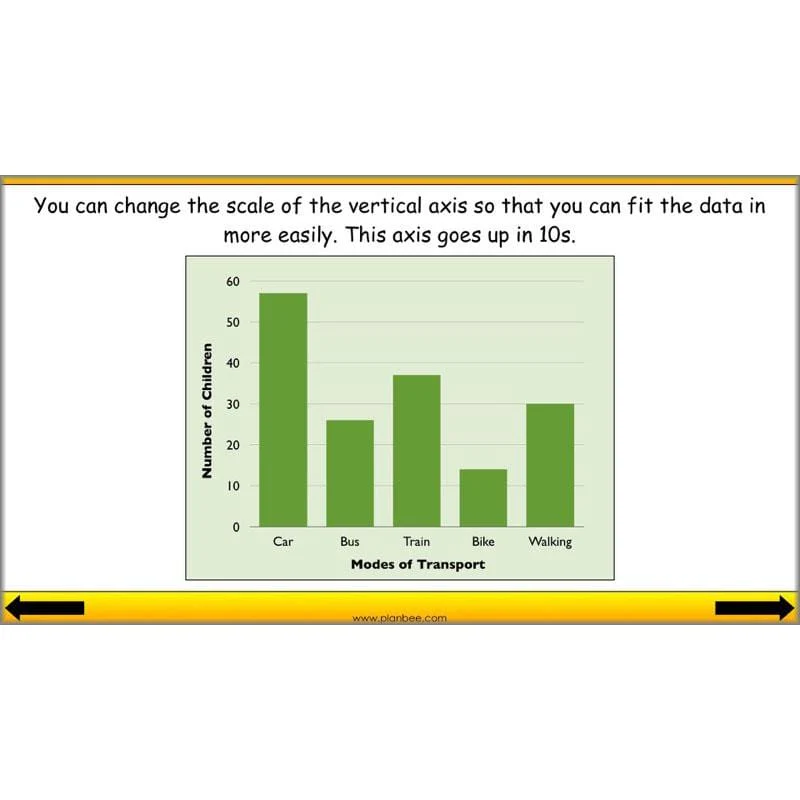
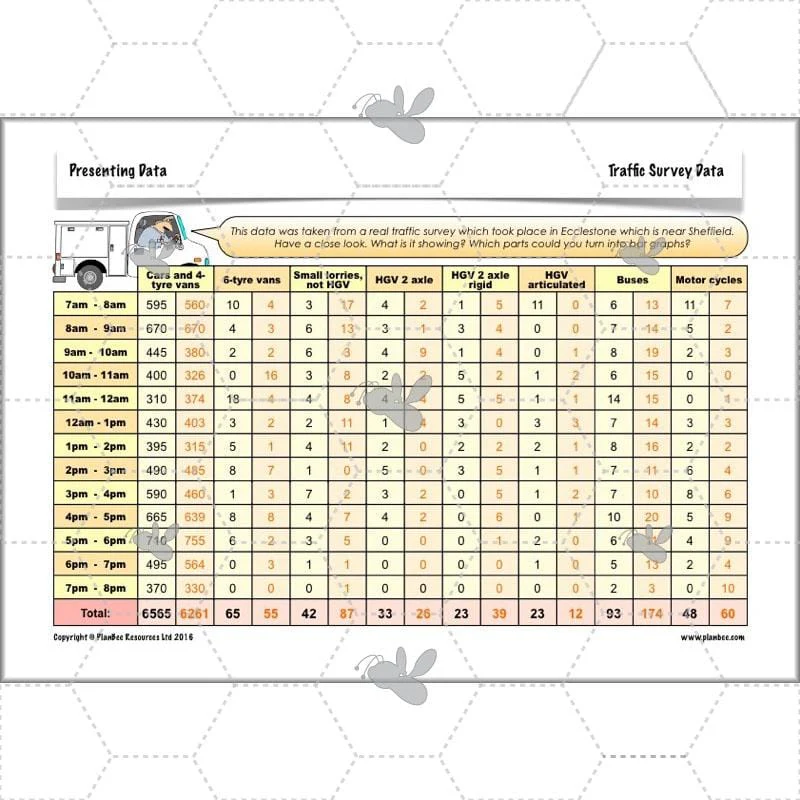
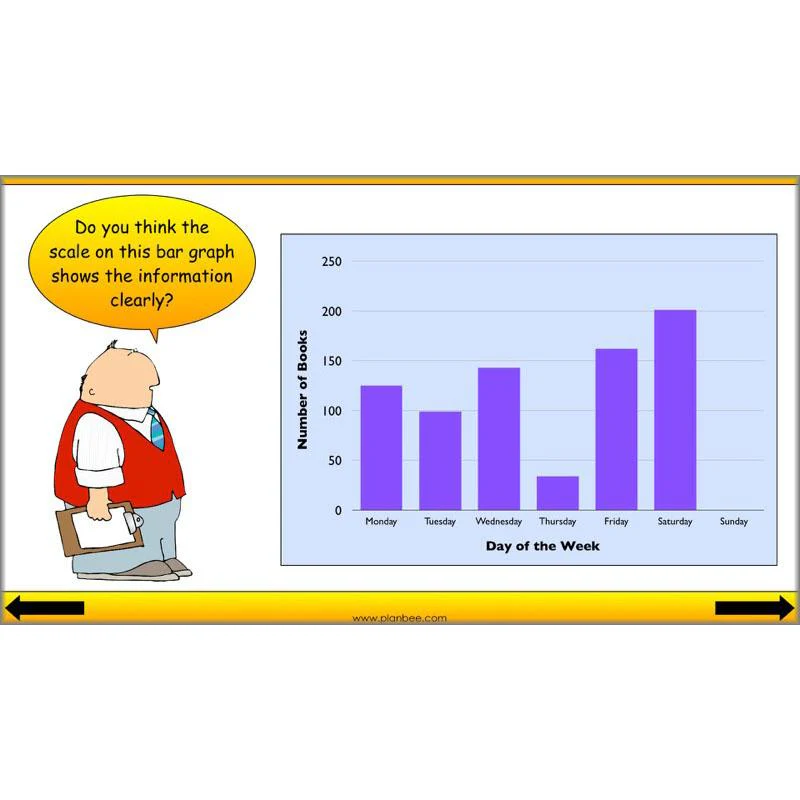
Changing Graph Scales
This lesson looks at how to create bar graphs that are appropriate for the data they are presenting by exploring different scales for the vertical axis. It looks at how different scales on identical bar graphs changes the meaning of the information before giving your class the chance to create their own bar graphs, choosing appropriate scales.
This downloadable lesson includes a lesson plan, slideshow presentation and printable teaching resources.
What's included:
- Lesson plan
- Slides
- Activity ideas
- Differentiated worksheets
- Challenge cards
- Traffic survey data
View Lesson 4
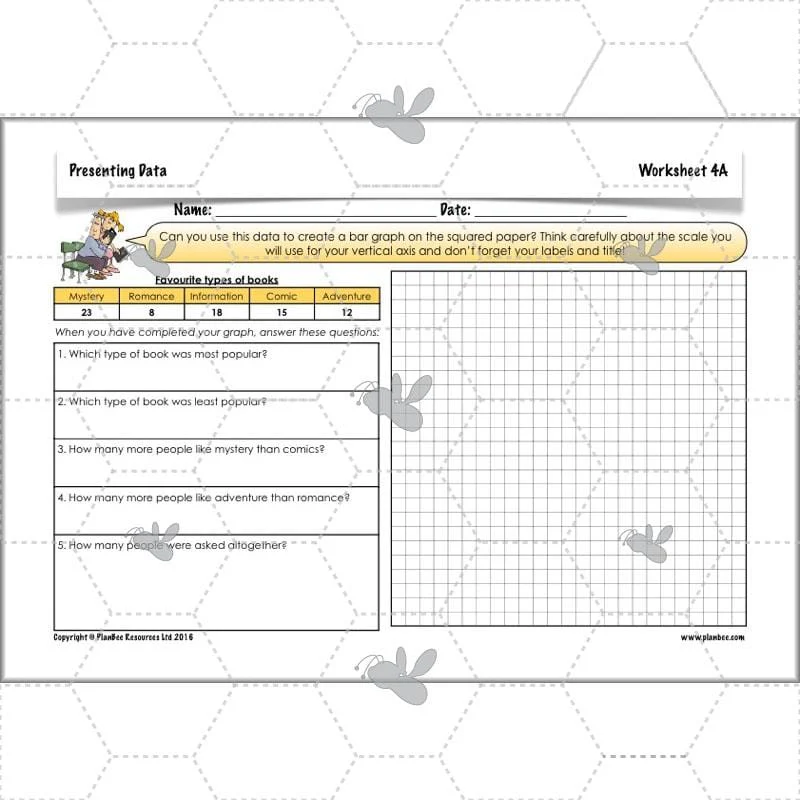
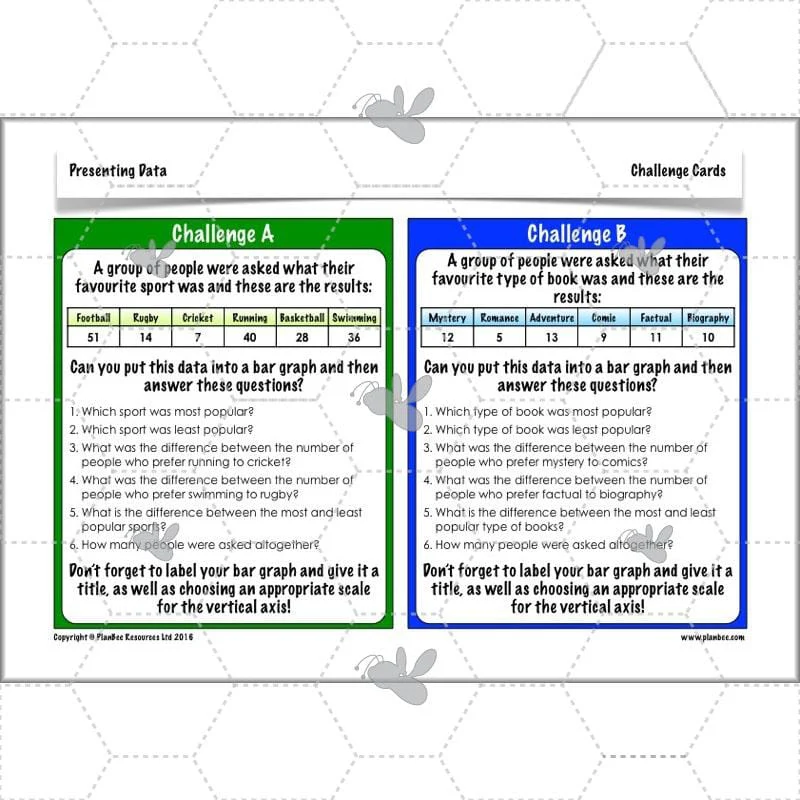
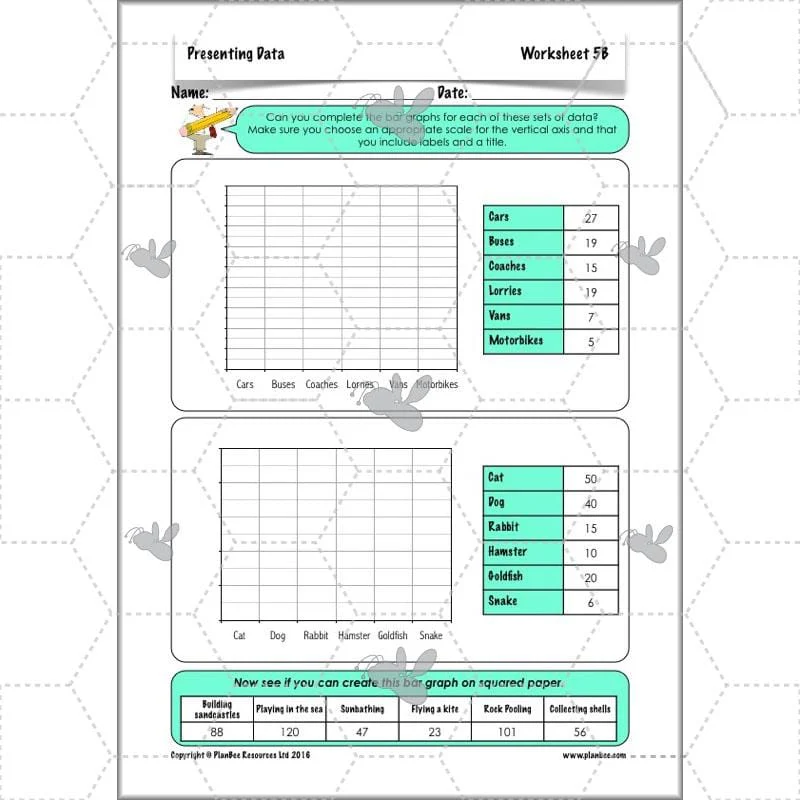
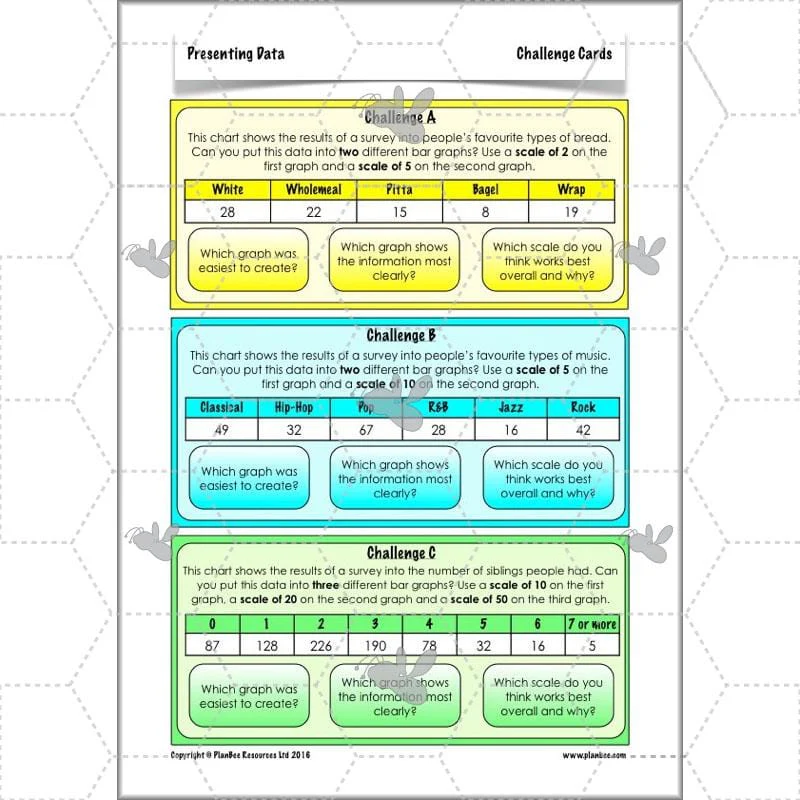
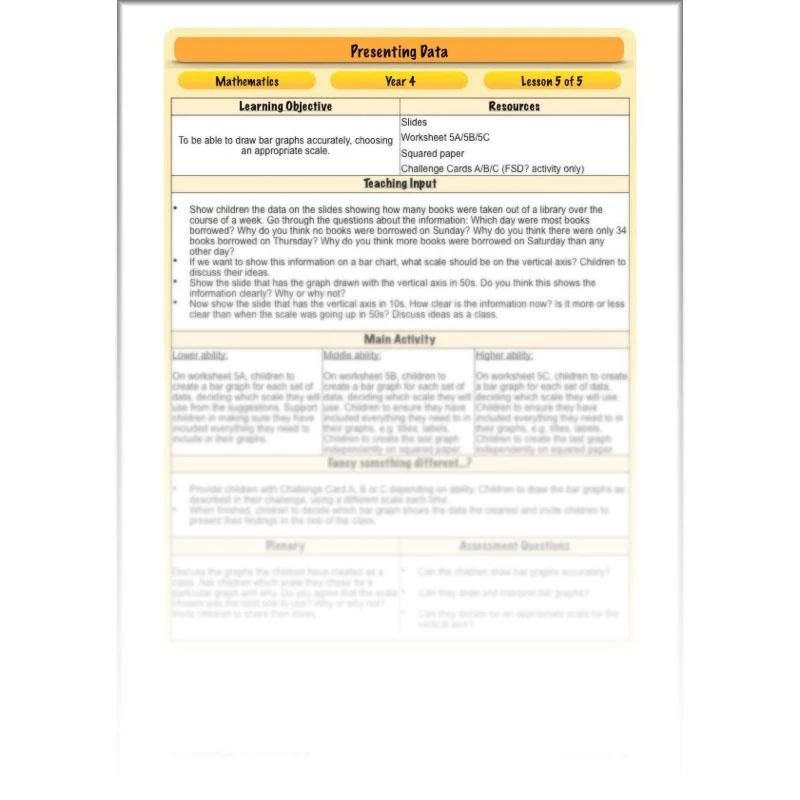
Creating Bar Graphs
The final lesson in this series gives your class further opportunities to practise their bar graph skills as they either complete bar graphs by choosing appropriate scales and adding the data, or creating their own from scratch. They can also see how the same data looks different when a different scale is used and how this affects the presentation of the information.
This downloadable lesson includes a lesson plan, slideshow presentation and printable teaching resources.
What's included:
- Lesson plan
- Slides
- Activity ideas
- Differentiated worksheets
- Challenge cards
View Lesson 5
Original: $4.65
-65%$4.65
$1.63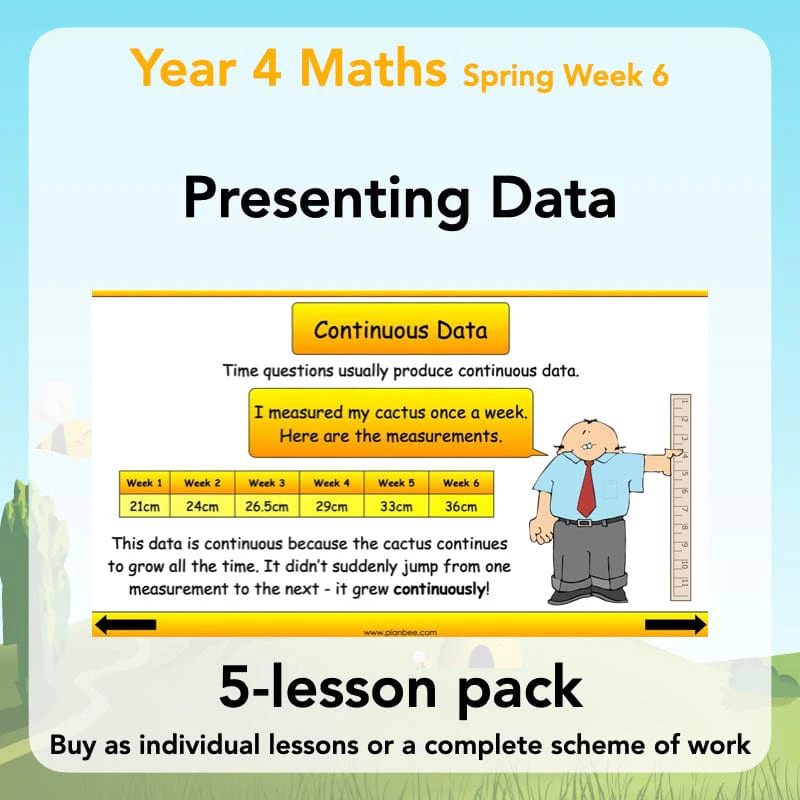


Description
In these complete lessons for Year 4, children will read and interpret data presented in a variety of ways, and generate their own questions which can be answered by studying data.
They will consider how best to both continuous and discrete data using line graphs and bar charts as well as planning surveys and collecting data using tally charts.
With lesson plans, slides, activity ideas, differentiated worksheets and more, these KS2 'Presenting Data' lessons provide all you need to teach your Year 4 class the best ways to present information through a variety of fun activities.
Reading Line Graphs
In this lesson, children will consider why line graphs are often preferable to bar charts for showing changes over time. They will look at a number of examples of sets of data and decide on the best way to present them and answer questions about them.
This downloadable lesson includes a lesson plan, slideshow presentation and printable teaching resources.
What's included:
- Lesson plan
- Slides
- Activity ideas
- Differentiated worksheets
- Challenge cards
View Lesson 1
Drawing Line Graphs
Show children how to draw line graphs and plot data on them, then challenge them to plot given sets of data on partially completed line graphs, or start from scratch on graph paper! In this lesson, the scales for the graphs children will draw are given, so they can focus on drawing and plotting accurately.
This downloadable lesson includes a lesson plan, slideshow presentation and printable teaching resources.
What's included:
- Lesson plan
- Slides
- Activity ideas
- Differentiated worksheets
- Blank maths frames
View Lesson 2
Continuous Data
Building on the learning of the previous two lessons in this scheme of work, the included slides explain some differences between continuous and discrete data, giving examples. Children are challenged to not only read and interpret data on line graphs, but predict trends based on the given data. Following this, children may either practise plotting continuous data, or look at unlabelled line graphs, suggesting what kind of data they might show.
This downloadable lesson includes a lesson plan, slideshow presentation and printable teaching resources.
What's included:
- Lesson plan
- Slides
- Activity ideas
- Differentiated worksheets
- Challenge cards
View Lesson 3
Changing Graph Scales
This lesson looks at how to create bar graphs that are appropriate for the data they are presenting by exploring different scales for the vertical axis. It looks at how different scales on identical bar graphs changes the meaning of the information before giving your class the chance to create their own bar graphs, choosing appropriate scales.
This downloadable lesson includes a lesson plan, slideshow presentation and printable teaching resources.
What's included:
- Lesson plan
- Slides
- Activity ideas
- Differentiated worksheets
- Challenge cards
- Traffic survey data
View Lesson 4
Creating Bar Graphs
The final lesson in this series gives your class further opportunities to practise their bar graph skills as they either complete bar graphs by choosing appropriate scales and adding the data, or creating their own from scratch. They can also see how the same data looks different when a different scale is used and how this affects the presentation of the information.
This downloadable lesson includes a lesson plan, slideshow presentation and printable teaching resources.
What's included:
- Lesson plan
- Slides
- Activity ideas
- Differentiated worksheets
- Challenge cards
View Lesson 5